제5장 수평 바차트의 데이터라벨 달기
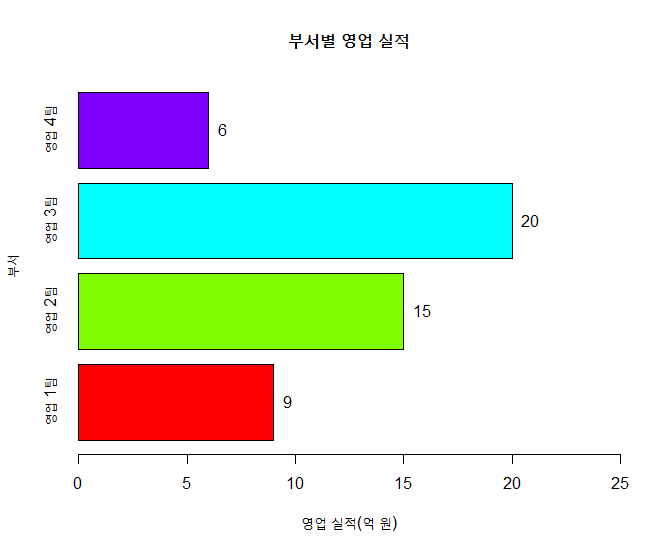
xxxxxxxxxxheight <- c(9, 15, 20, 6)name <- c("영업 1팀", "영업 2팀", "영업 3팀", "영업 4팀")bp <- barplot(height, names.arg=name, main="부서별 영업 실적", xlim=c(0,25), # x축의 상한값 조절 col=rainbow(length(height)), xlab="영업 실적(억 원)", ylab="부서", horiz=TRUE, width=50 )결과 :

xxxxxxxxxxtext(x=height, # x 축이 영업실적. 이에 대하여 라벨을 달 것임. y=bp, labels=round(height,0), **# height 값의 데이터 라벨 지정** pos=4 **# pos=4** )#===== 수평 바차트의 데이터라벨 달기 끝결과 :


![]()
![]()
![]()