제5장 스택형 바차트에 라벨달기
xxxxxxxxxxheight1 <- c(4, 18, 5, 8)height2 <- c(9, 15, 20, 6)height <- rbind(height1, height2)height결과 :
xxxxxxxxxx## [,1] [,2] [,3] [,4]## height1 4 18 5 8## height2 9 15 20 6
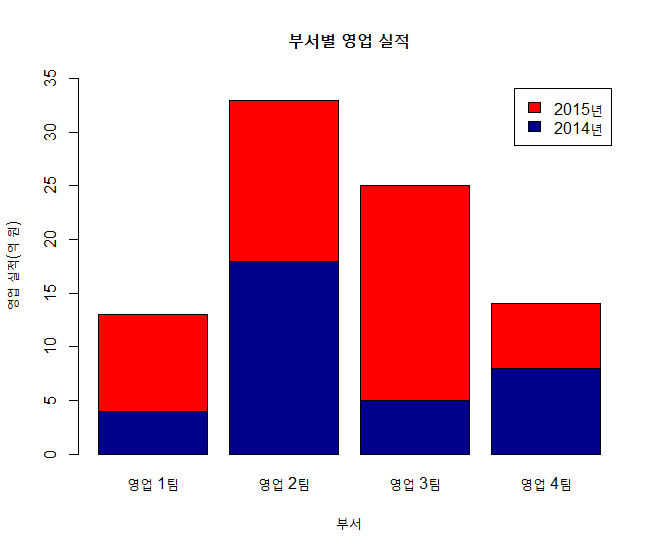
xxxxxxxxxxname <- c("영업 1팀", "영업 2팀", "영업 3팀", "영업 4팀")legend_lbl <- c("2014년", "2015년")bp <- barplot(height, main = "부서별 영업 실적", names.arg = name, xlab = "부서", ylab = "영업 실적(억 원)", col = c("darkblue","red"), legend.text = legend_lbl, ylim = c(0, 35))결과 :
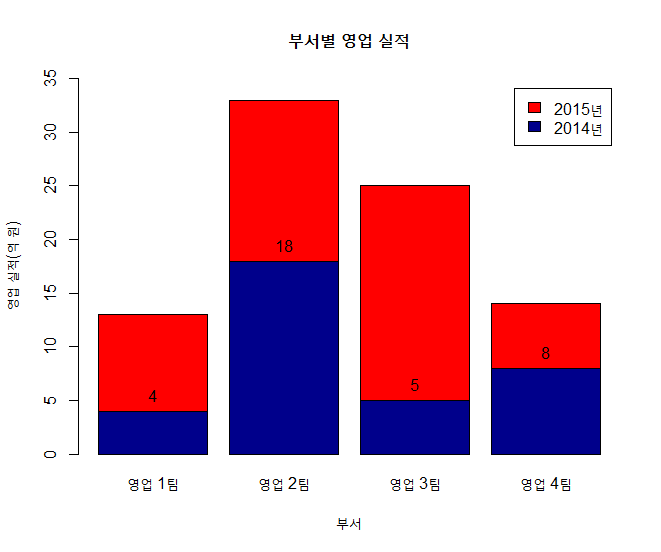
xxxxxxxxxxtext(x=bp, y=height1, labels=round(height1,0), pos=3) # 2014년 데이터에 라벨달기결과 :
xxxxxxxxxxtext(x=bp, y=height1 + height2, labels=round(height2,0), pos=3) # 2015년 데이터에 라벨달기결과 :

[ R Source ]


![]()
![]()
![]()