제5장 그룹형 바차트에 라벨달기
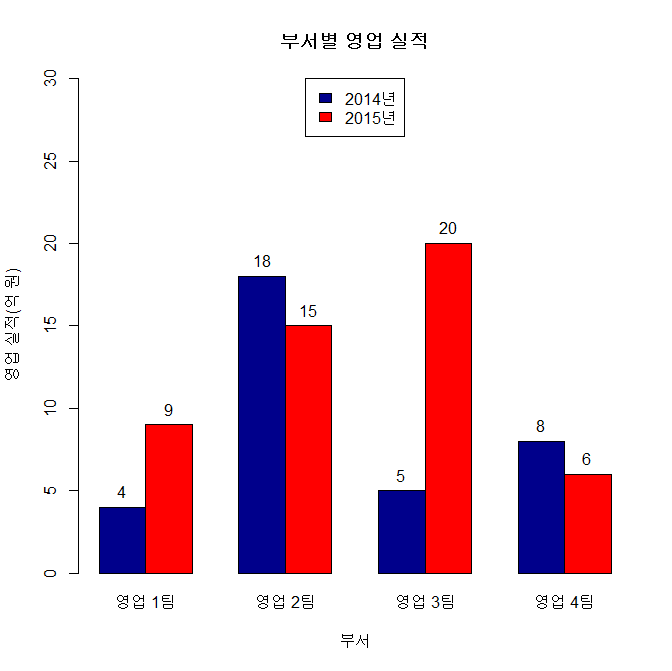
xxxxxxxxxx# ch_5_131_Labelling_Grouped_Bar_Chart# 그룹형 바 차트(Grouped Bar Chart)height1 <- c(4, 18, 5, 8) # Group 1 = 2014년height2 <- c(9, 15, 20, 6) # Group 2 = 2015년height <- rbind(height1, height2)name <- c("영업 1팀", "영업 2팀", "영업 3팀", "영업 4팀")legend_lbl <- c("2014년", "2015년")bp <- barplot(height, main="부서별 영업 실적", names.arg=name, xlab="부서", ylab="영업 실적(억 원)", col=c("darkblue","red"), legend.text=legend_lbl, ylim=c(0, 30), beside=TRUE, args.legend=list(x='top'))text(x=bp, y=height, labels=round(height,0), pos=3)결과 :


![]()
![]()
![]()