제5장 히스토그램에 데이터라벨 달기 (1)
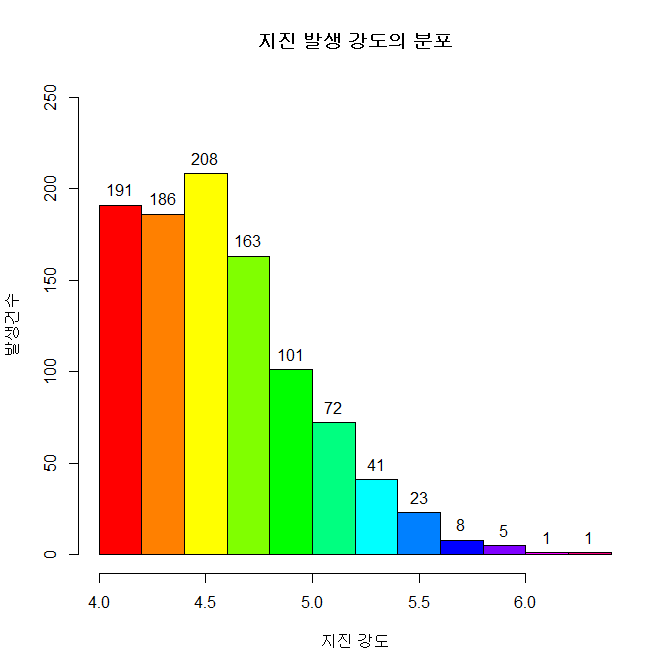
xxxxxxxxxx# p. 139-140#====== hist() -> plot()으로 전환해서 라벨달기head(quakes)mag <- quakes$maghp <- hist(mag) plot(hp,, main="지진 발생 강도의 분포", col=rainbow(length(height)), xlab="지진 강도", ylab="발생건수", ylim=c(0,250))(height <- hp$counts)text(x=hp$mids, y=height, labels=height, pos=3)#======= 라벨달기 끝결과 :


![]()
![]()
![]()