제5장 히스토그램에 데이터라벨 달기 (2)
xxxxxxxxxx# ch_5_141_Labelling_Histogram_02#====== hist() -> plot()으로 전환해서 라벨달기head(quakes)mag <- quakes$mag# 계급 구간과 색 colors <- c("red", "orange", "yellow", "green", "blue", "navy", "violet")hp <- hist(mag, breaks=seq(4, 6.5, by=0.5)) 결과 :
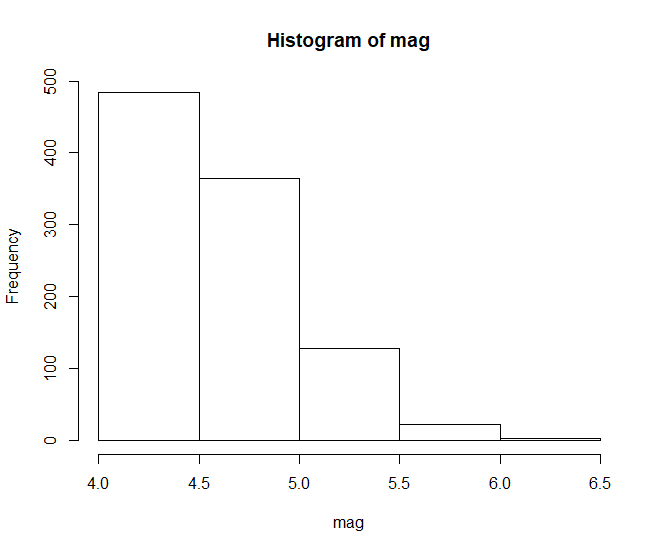
xxxxxxxxxxhp # 변수 hp 의 값들을 꼭 확인해 보기 바람.결과 :
xxxxxxxxxx## $breaks## [1] 4.0 4.5 5.0 5.5 6.0 6.5## ## $counts## [1] 484 365 127 22 2## ## $density## [1] 0.968 0.730 0.254 0.044 0.004## ## $mids## [1] 4.25 4.75 5.25 5.75 6.25## ## $xname## [1] "mag"## ## $equidist## [1] TRUE## ## attr(,"class")## [1] "histogram"
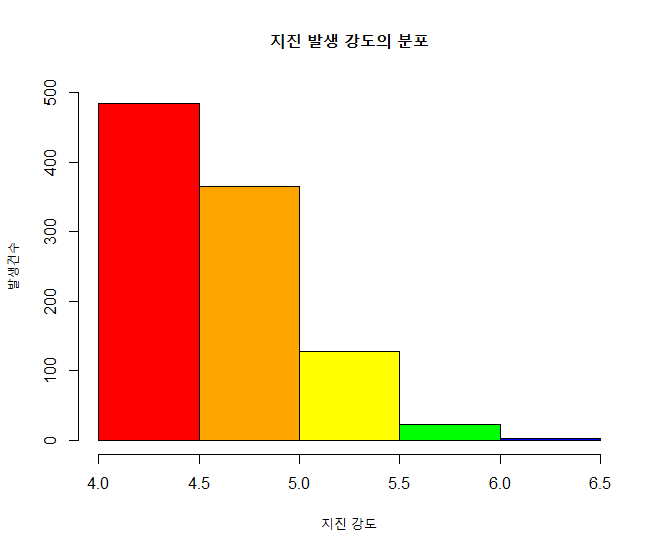
xxxxxxxxxxplot(hp,, main="지진 발생 강도의 분포", xlab="지진 강도", ylab="발생건수", col=colors, ylim=c(0,500))
결과 :
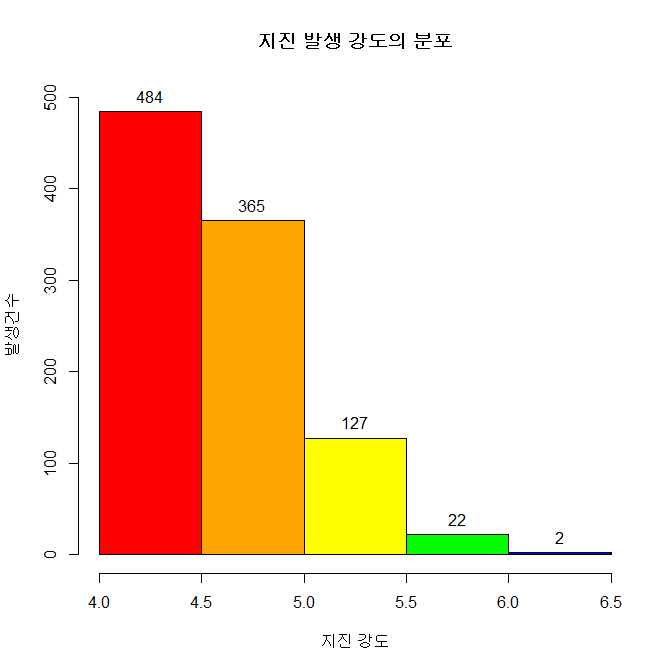
xxxxxxxxxx(height <- hp$counts)text(x=hp$mids, y=height, labels=height, pos=3)#======= 라벨달기 끝결과 :


![]()
![]()
![]()