제5장 히스토그램에 데이터라벨 달기 (3)
#####
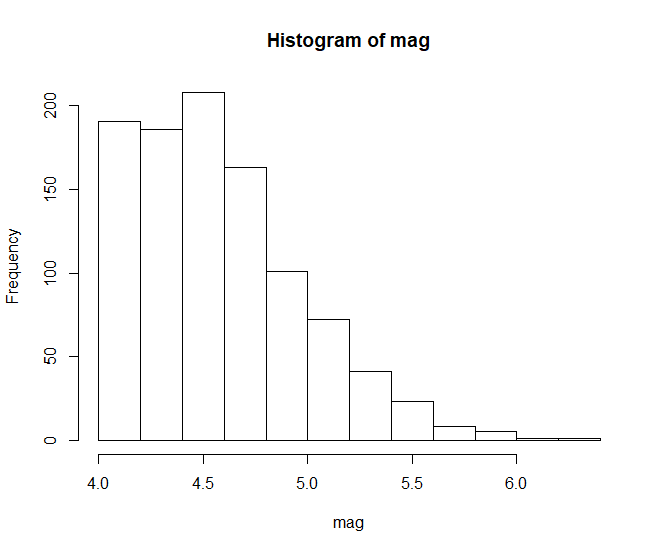
xxxxxxxxxxhead(quakes)mag <- quakes$magh <- hist(mag, breaks="Sturges")결과 :
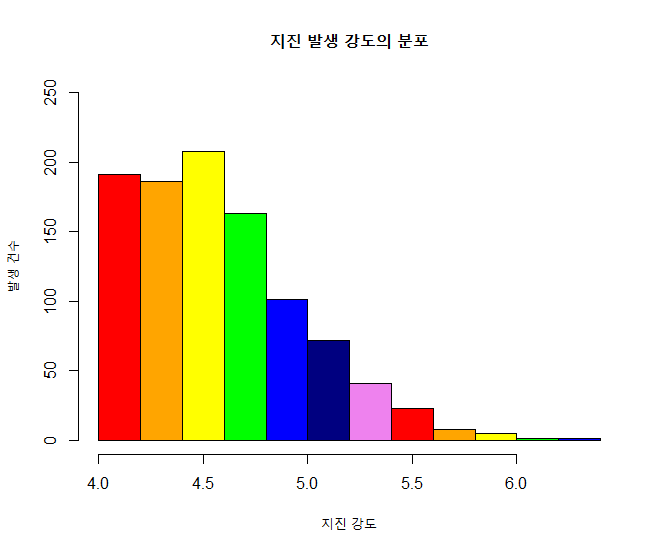
xxxxxxxxxxplot(h,, main="지진 발생 강도의 분포", xlab="지진 강도", ylab="발생 건수", col=colors, ylim=c(0,250))결과 :
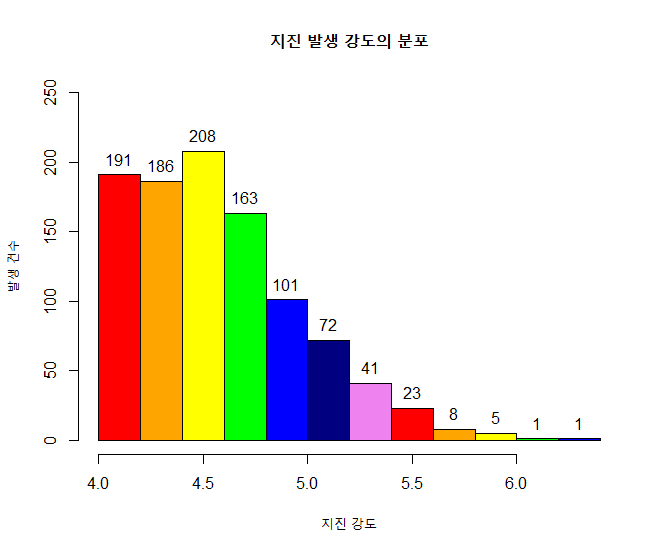
xxxxxxxxxx#=== 라벨달기(height <- h$counts)text(x=h$mids, y=height, labels=round(height,0), pos=3)#=== 라벨달기 끝결과 :


![]()
![]()
![]()