제5장 박스플롯 데이터라벨 달기
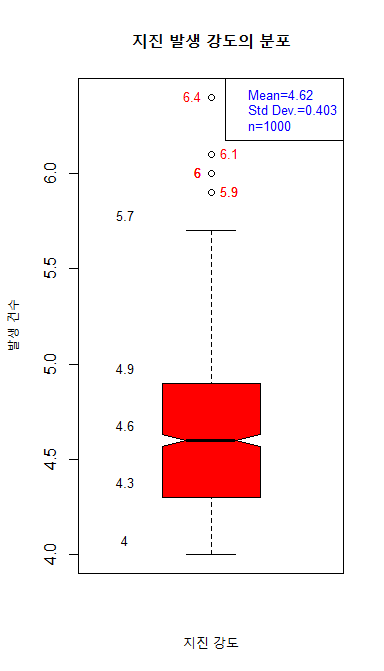
xxxxxxxxxx#----- p. 146 박스 플롯에 데이터 라벨달기**# I. Box plotmag <- quakes$mag# change the plot window size : (7 x 7) => (4 X 7)win.graph(4,7)# 1. Box Plotboxstats <- boxplot(mag, main="지진 발생 강도의 분포", xlab="지진 강도", ylab="발생 건수", col="red", notch=TRUE)# 2. Display the points => points()len <- length(mag) # the number of datapoints(mag, rep(1,len)) # position of points : (x, y=1) # 3. Display fivenumbers => boxstats$stats# ⇒ text(x, y, labels) text(0.65, boxstats$stats, labels=boxstats$stats, pos=3, cex=0.8) # cex=0.8 : size of tex # pos = 1, 2, 3, 4# 4. display legend (Mean, Std Dev., n) ⇒ legend()# paste0()legend("topright", paste0(c("Mean", "Std Dev.", "n"), "=", round(c(mean(mag), sd(mag), length(mag)), 3)), text.col = 4, # color of legend text cex=0.8) # size of legend text# 5. Display Outlierstext( rep(1, NROW(boxstats$out)), boxstats$out, labels = boxstats$out, pos = c(4,2,2,4,4,2,2), cex = 0.8, col = "red")#---- 데이터 라벨 달기 끝결과 :
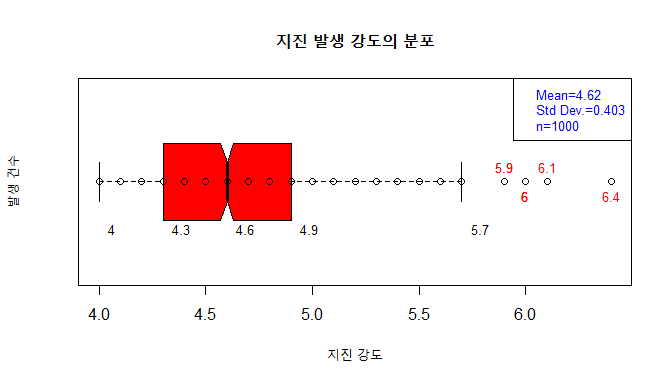
xxxxxxxxxx#----- p. 146 박스 플롯을 수평으로 하고, 데이터 라벨 달기# II. horizontal box plotmag <- quakes$mag# change the plot window size : (7 x 7) => (7 X 4)win.graph(7,4)# 1. Horizontal Box Plotboxstats <- boxplot(mag, main="지진 발생 강도의 분포", xlab="지진 강도", ylab="발생 건수", col="red", notch=TRUE, horizontal=T)# 2. Display the points => points()len <- length(mag) # the number of datapoints(mag, rep(1,len)) # position of points : (x, y=1) # 3. Fivenumbers => boxstats$statstext(boxstats$stats, 0.75, labels=boxstats$stats, pos=4, cex=0.8) # cex=0.8 : size of tex # pos = 1, 2, 3, 4# 4. display legend (Mean, Std Dev., n) ⇒ legend()# paste0()legend("topright", paste0(c("Mean", "Std Dev.", "n"), "=", round(c(mean(mag), sd(mag), length(mag)), 3)), text.col = 4, # color of legend text cex=0.8) # size of legend text# 5. Displaying outlierstext( boxstats$out, rep(1, NROW(boxstats$out)), labels = boxstats$out, pos = c(3,1,1,3,3,1,1), cex=0.8, col="red")#---- 데이터 라벨 달기 끝결과 :


![]()
![]()
![]()