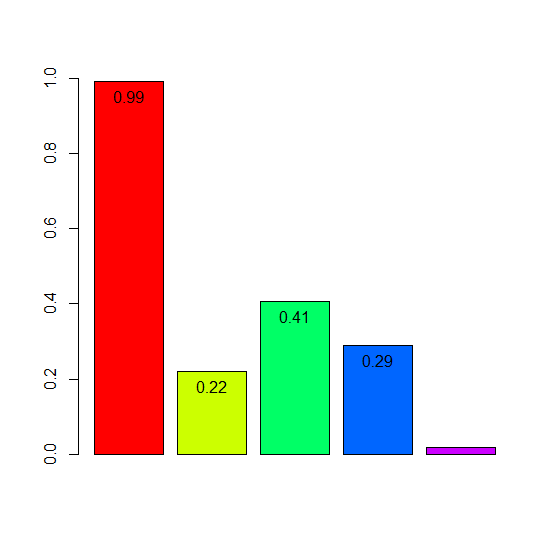
제5장 움직이는 차트에 데이터라벨 달기
xxxxxxxxxx# 1초 간격으로 그래프 그리기library(animation)ani.options(interval = 1)while(TRUE) { y <- runif(5, 0, 1) bp <- barplot(y, ylim = c(0, 1), col=rainbow(5)) text(x=bp, y=y, labels=round(y,2), # 라벨 y pos=1) ani.pause()}
주의 : 위의 바플롯이 계속 갱신이 됨..


