제5장 차트그리기 설명 및 예제
예제 1 : http://www.datamarket.kr/xe/index.php?mid=board_AGDR50&document_srl=201&listStyle=viewer
예제 4 : 3D Barplot
(latticeExtra 패키지 활용 : 설명서 파일 첨부)
xxxxxxxxxxinstall.packages(latticeExtra)library(latticeExtra)
xxxxxxxxxxd <- read.table(text='x y z t1 5 high t1 2 low t1 4 med t2 8 high t2 1 low t2 3 med t3 50 high t3 12 med t3 35 low', header=TRUE)d결과 :
xxxxxxxxxx## x y z## 1 t1 5 high## 2 t1 2 low## 3 t1 4 med## 4 t2 8 high## 5 t2 1 low## 6 t2 3 med## 7 t3 50 high## 8 t3 12 med## 9 t3 35 low
xxxxxxxxxxcloud(y ~ x + z, d, panel.3d.cloud = panel.3dbars, col.facet='grey', xbase=0.4, ybase=0.4, scales=list(arrows=FALSE, col=1), par.settings = list(axis.line = list(col = "transparent")))결과 : 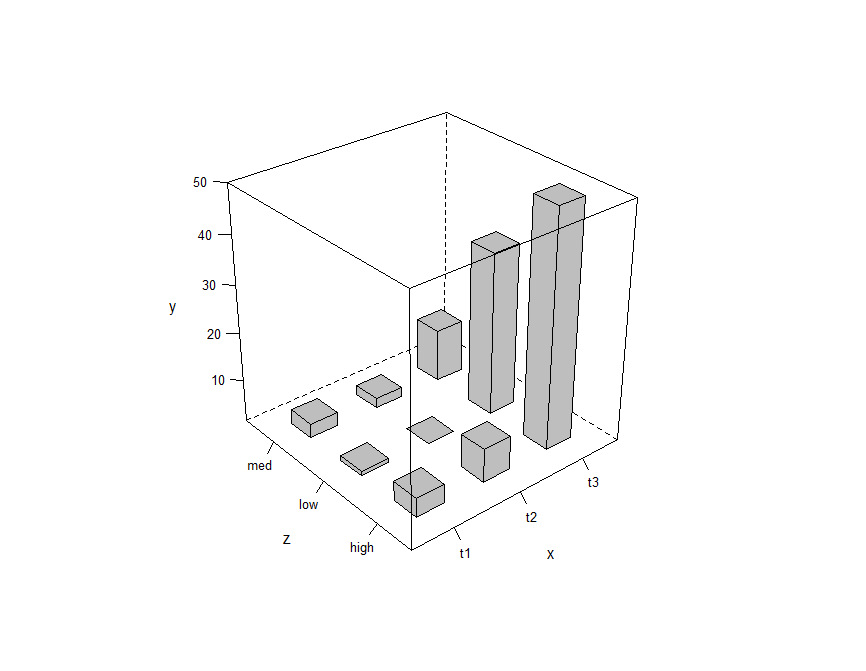
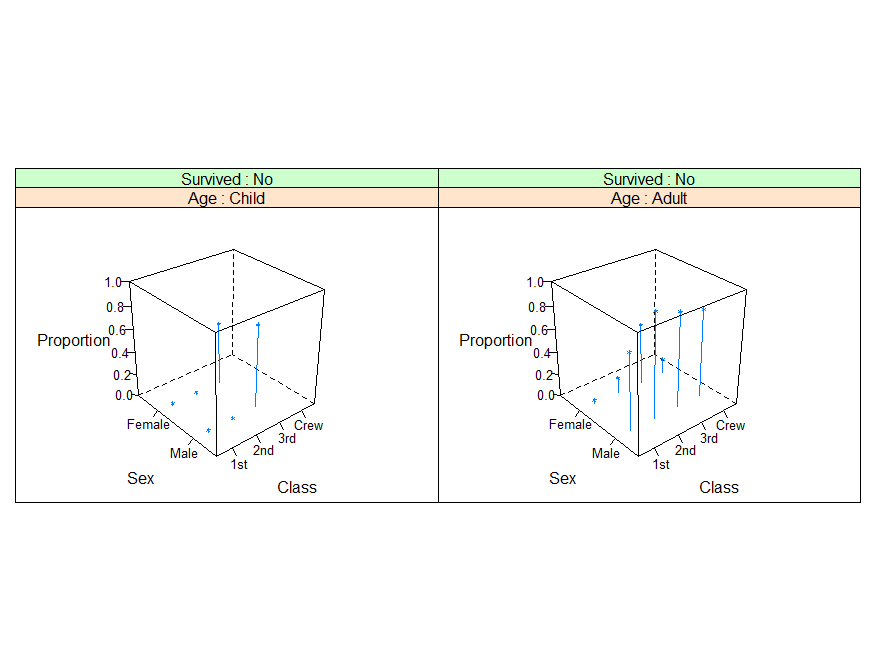
예제 5.
xxxxxxxxxxcloud(prop.table(Titanic, margin = 1:3), type = c("p", "h"), strip = strip.custom(strip.names = TRUE), scales = list(arrows = FALSE, distance = 2), panel.aspect = 0.7, zlab = "Proportion")[, 1]참고자료 : https://stat.ethz.ch/R-manual/R-devel/library/lattice/html/cloud.html
예제 6 : (lattice 패키지 설명서 p. 40 참조)
xxxxxxxxxx# volcano # 87 x 61 matrixwireframe(volcano, shade = TRUE, aspect = c(61/87, 0.4), light.source = c(10,0,10) )결과 : 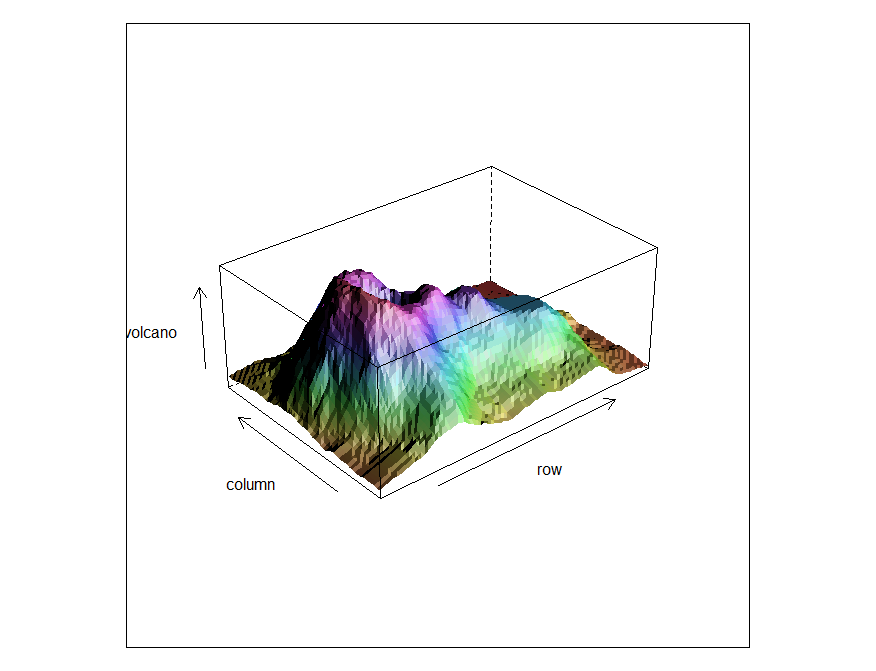
예제 7 : plot3D 패키지 활용 (패키지 설명서 파일 참조) & 참고사이트[매우 재미있음]
xxxxxxxxxx# 설명서 3쪽의 예제 : 화산install.packages("plot3D")library(plot3D)image2D(Hypsometry, xlab = "longitude", ylab = "latitude", contour = list(levels = 0, col = "black", lwd = 2), shade = 0.1, main = "Hypsometry data set", clab = "m")rect(-50, 10, -20, 40, lwd = 3)ii <- which(Hypsometry$x > -50 & Hypsometry$x < -20)jj <- which(Hypsometry$y > 10 & Hypsometry$y < 40)zlim <- c(-10000, 0)결과 : 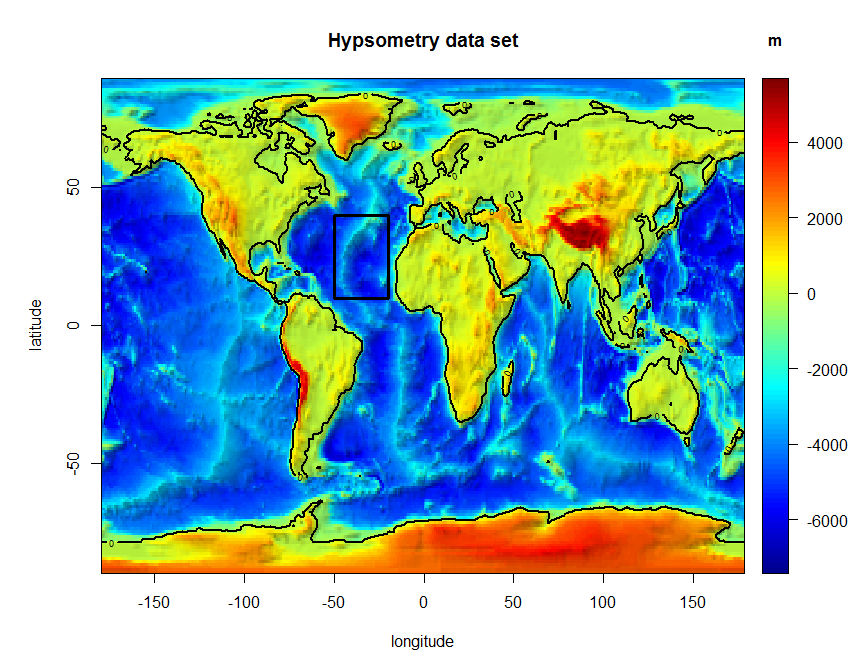


![]()
![]()
![]()