21.2 그래프 유형 type, 기호 모양 pch, 크기 cex, 선 유형 lty, 선 두께 lwd
출처: https://rfriend.tistory.com/149?category=605866
지난번 포스팅에서 R 그래프 모수 (Graphical Parameters)를 설정하는 2가지 방법(par(), arguments)에 대해서 소개하였습니다.
이번 절에서는 그래프 모수의 유형(type), 기호(pch), 선(lty, lwd) 등의 모수 설정에 대해서 하나씩 예를 들어보면서 자세히 살펴 보겠습니다.
그래프 모수가 70여 가지가 되기 때문에, 자주 사용하는 것들을 위주로 살펴 보겠습니다. 자세한 것은 ? par 의 도움말을 보면 모든 그래프 모수에 대한 도움말을 검색할 수 있습니다.
21.2.1 그래프 유형 (type)
그래프의 유형으로 type = 의 값은 l, h, b, o, s, n등을 가질 수 있습니다.
library(MASS)

##--------
# 다양한 그래프 유형을 선택할 수 있습니다. type = l, h, b, o, s, n
# 자동차의 무게 Weight 별로 정렬합니다.
Cars93_1 <- Cars93[order(Cars93$Weight),]

# 그래프를 표시할 윈도우 프레임을 분할합니다.
par(mfrow = c(3, 2))                        # 3행 2열로 그래프를 그립니다.

# type 별로 그래프를 작성합니다.
attach(Cars93_1)
## The following object is masked _by_ .GlobalEnv:
##
## Cylinders# type = "l" : line plot
plot(MPG.highway ~ Weight, type = "l", main = "type = l")
# type = "h" : high density needle plot
plot(MPG.highway ~ Weight, type = "h", main = "type = h")
# type = "b" : both dot and line plot
plot(MPG.highway ~ Weight, type = "b", main = "type = b")
# type = "o" : overlapped dot and line plot
plot(MPG.highway ~ Weight, type = "o", main = "type = o")
# type = "s" : step plot
plot(MPG.highway ~ Weight, type = "s", main = "type = s")
# type = "n" : empty plot
plot(MPG.highway ~ Weight, type = "n", main = "type = n") 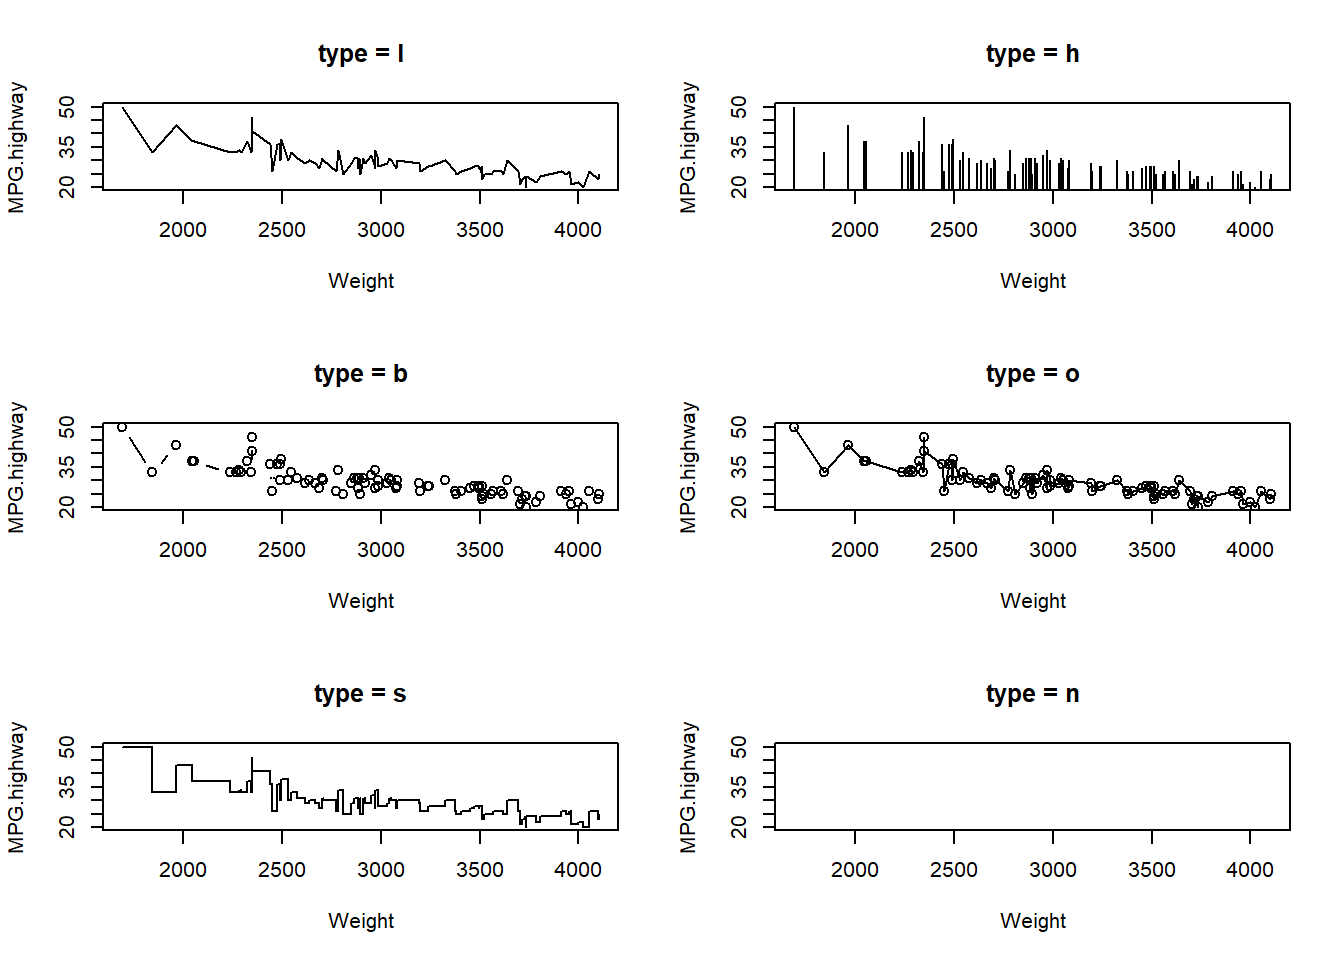
detach(Cars93_1)21.2.2 기호 (plotting symbols, characters) : pch =
21.2.2.1 기호를 번호로 지정하기
그래픽 모수 pch = 를 사용해서 다양한 모양의 기호, 상징으로 데이터의 각 점을 표시할 수 있습니다. 기본 값은 pch = 1 로서 속이 빈 원 모양이며, 아래의 pch 그래픽 모수의 숫자별 모양을 참고해서 원하는 모양의 숫자를 pch = '숫자' 로 입력하면 됩니다.

Cars93 데이터 프레임의 차 무게(Weight)와 마력(Horsepower)과 고속도로연비(MPG.highway) 간의 관계를 알아보기 위해 산점도를 pch=1 ~ pch=6 까지 6개만 예로 다음과 같이 그려 보았습니다.
library(MASS)
## symbol and character of plotting : pch=
# 그래프를 표시할 윈도우 프레임을 분할합니다.
par(mfrow = c(3,2))

# pch = 2, 4, 6, 8, 10, 12
plot(MPG.highway ~ Weight, data = Cars93, pch = 2, main = "pch = 2")
plot(MPG.highway ~ Weight, data = Cars93, pch = 4, main = "pch = 4")
plot(MPG.highway ~ Weight, data = Cars93, pch = 6, main = "pch = 6")
plot(MPG.highway ~ Weight, data = Cars93, pch = 8, main = "pch = 8")
plot(MPG.highway ~ Weight, data = Cars93, pch = 10, main = "pch = 10")
plot(MPG.highway ~ Weight, data = Cars93, pch = 12, main = "pch = 12")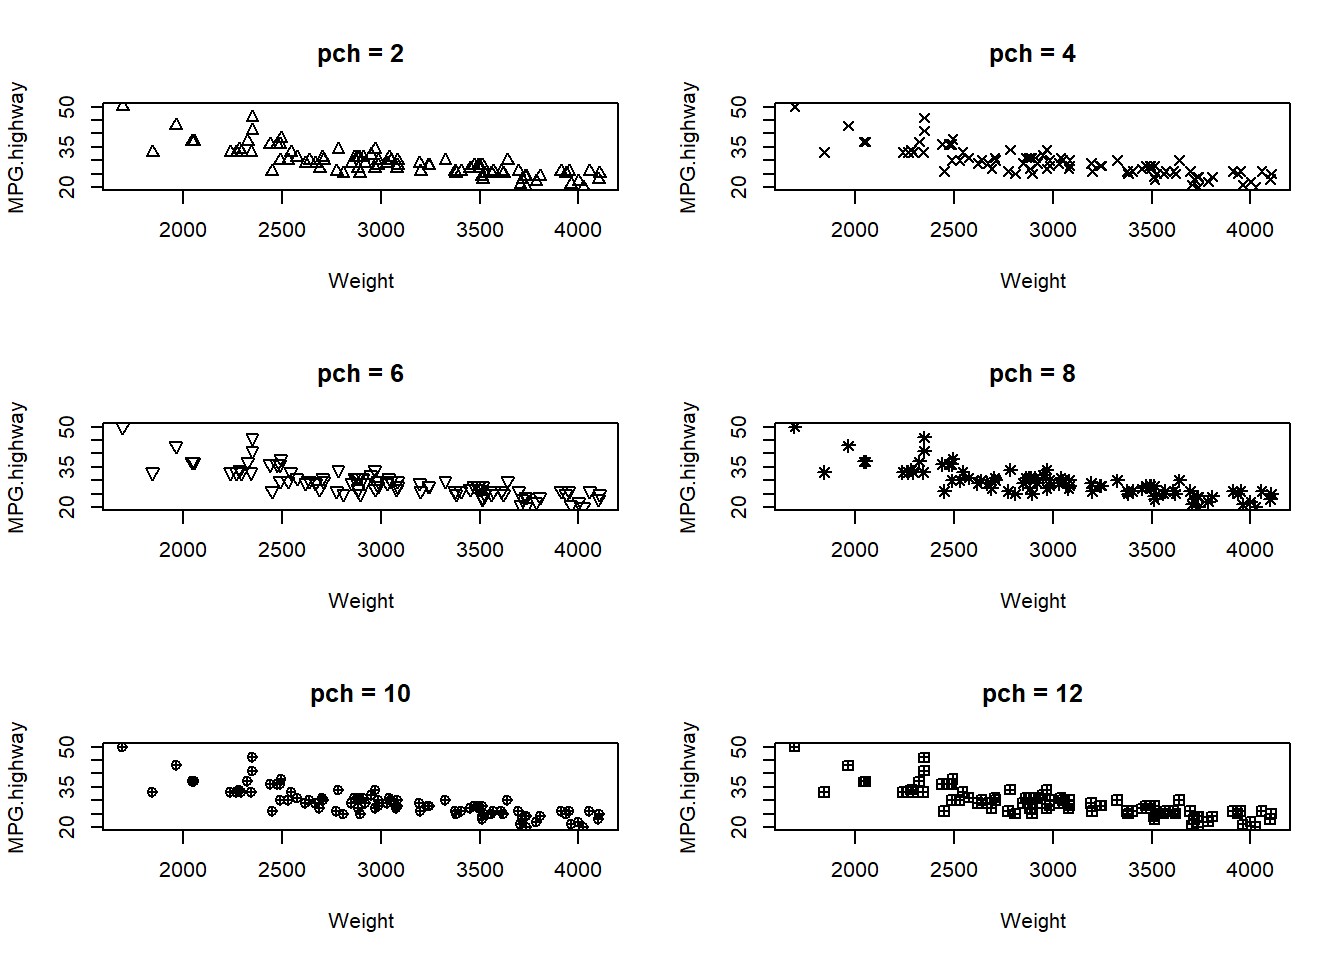
par(mfrow = c(1,1))21.2.2.2 기호를 직접 입력하기
pch = 1 처럼 숫자를 입력하는 방법 말고도 pch = '$', pch = '%', pch = '*'처럼 기호를 직접 pch 다음에 직접 입력해도 됩니다.
library(MASS)
## 기호를 직접 입력하기
par(mfrow = c(1,3))

plot(MPG.highway ~ Weight, data = Cars93, pch = '$', main = "pch = '$' ")
plot(MPG.highway ~ Weight, data = Cars93, pch = '%', main = "pch = '%' ")
plot(MPG.highway ~ Weight, data = Cars93, pch = '*', main = "pch = '*' ")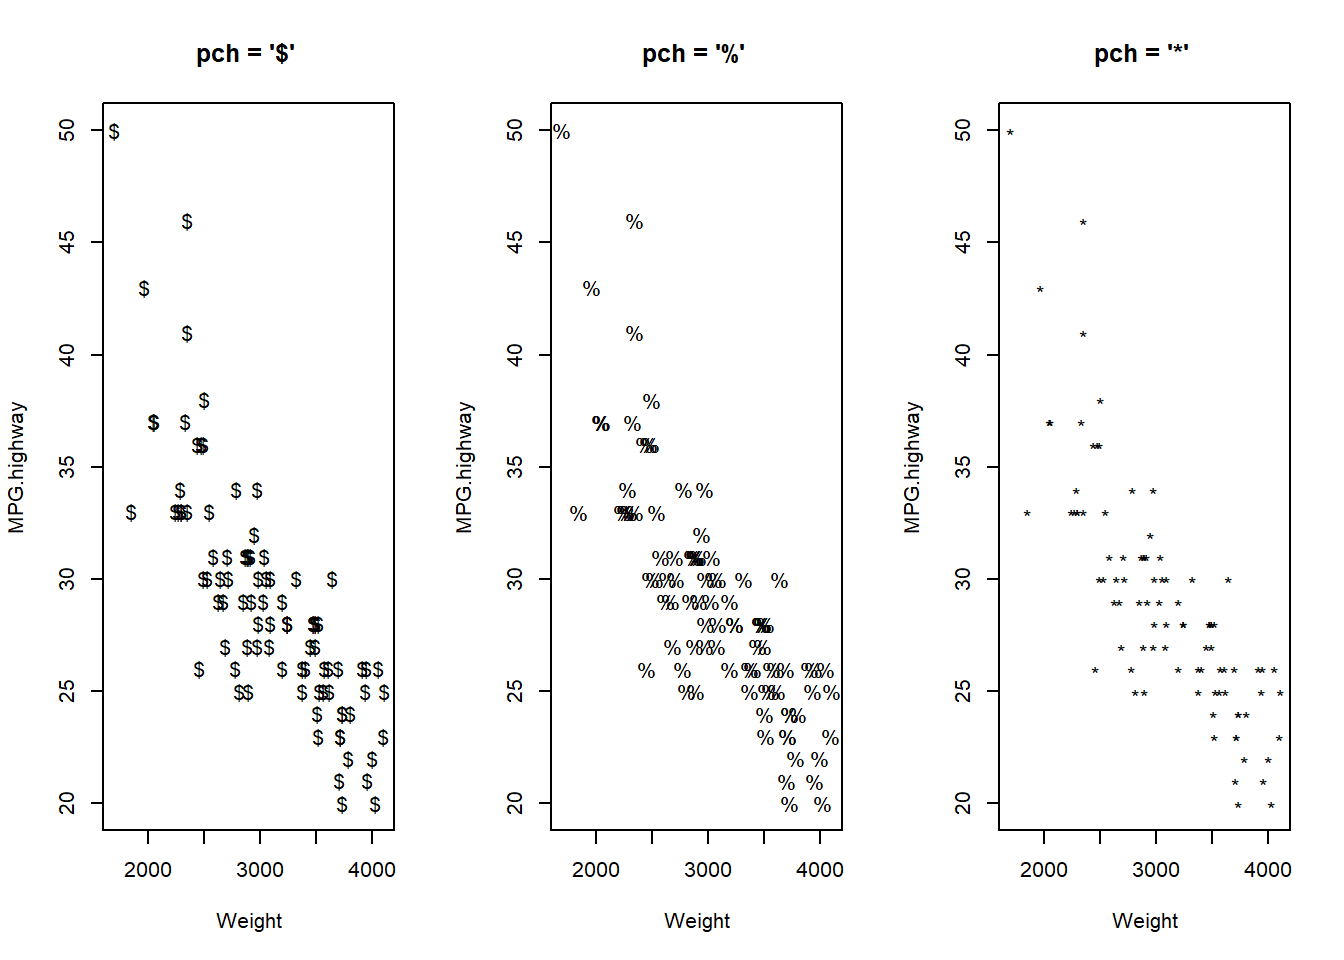
par(mfrow = c(1,1))21.2.3 기호의 크기 : cex
cex는 기호의 크기를 지정할 때 사용합니다. cex = 1 이 기본 값 크기이며, cex 다음에 입력하는 숫자는 디폴트 대비 상대적인 크기를 나타냅니다. 1 값을 기준으로 1보다 크면 글자가 커지고, 1보다 작으면 글자가 작아 집니다.
library(MASS)
## 기호의 크기 : cex
par(mfrow = c(2, 3))

# plot display by 2 row and 3 column
plot(MPG.highway ~ Weight, data = Cars93, pch = 19, cex = 0.5, main = "cex = 0.5")
plot(MPG.highway ~ Weight, data = Cars93, pch = 19, cex = 0.8, main = "cex = 0.8")
plot(MPG.highway ~ Weight, data = Cars93, pch = 19, cex = 1, main = "cex = 1 (default)")
plot(MPG.highway ~ Weight, data = Cars93, pch = 19, cex = 1.2, main = "cex = 1.2")
plot(MPG.highway ~ Weight, data = Cars93, pch = 19, cex = 1.5, main = "cex = 1.5")
plot(MPG.highway ~ Weight, data = Cars93, pch = 19, cex = 2, main = "cex = 2")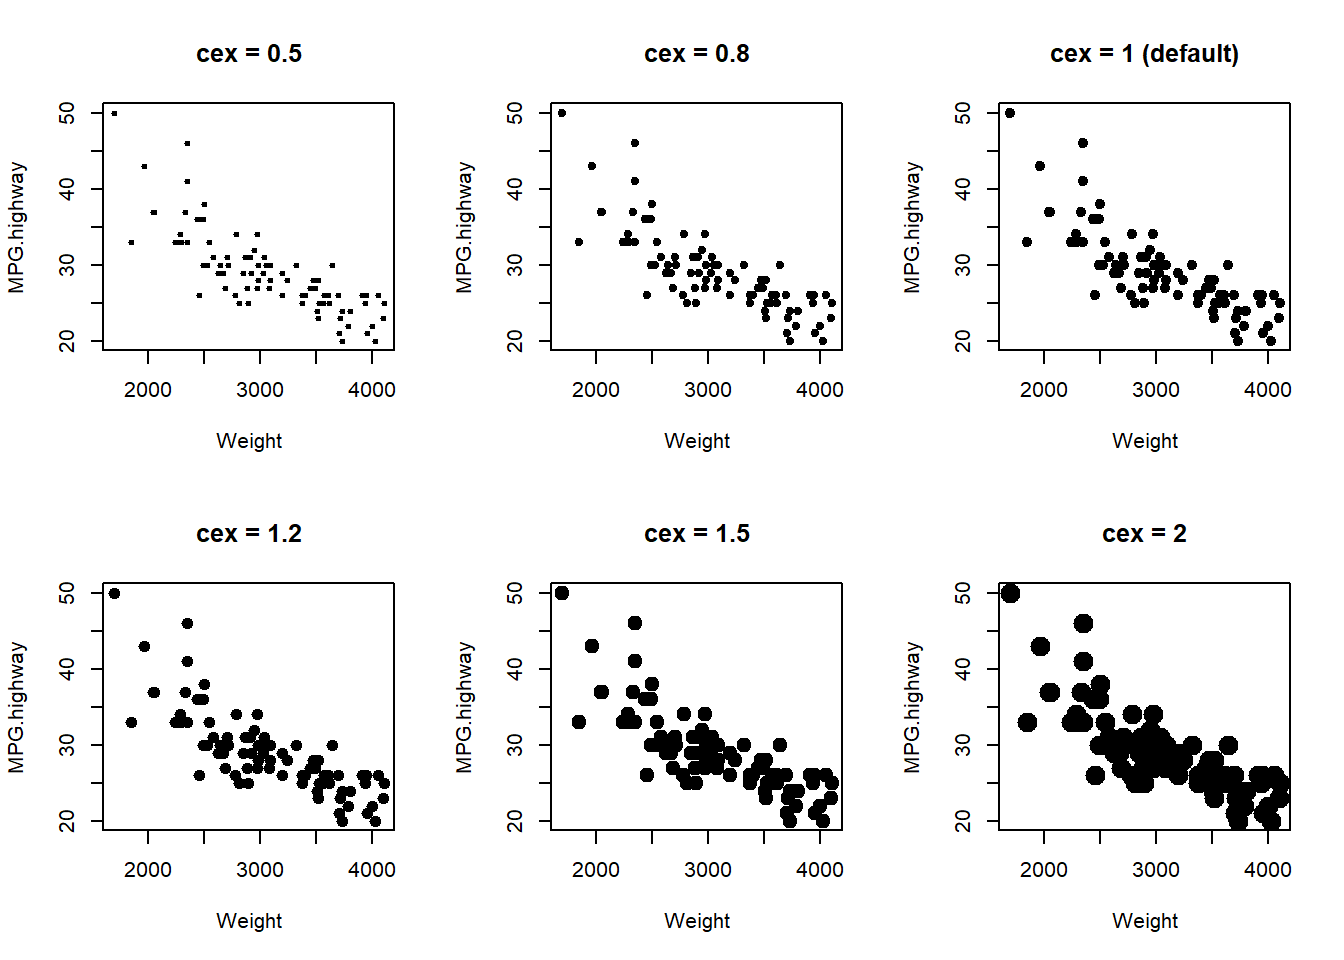
par(mfrow = c(1,1))21.2.4 선 스타일 지정하기
21.2.4.1 선의 유형 (line types) : lty
선의 유형을 쓰기 위해서는 type =이 l , b 또는 o로 지정이 되어 있어야 합니다. R 그래프 모수에서 제공하는 선 유형 인 lty =에는 아래과 같이 숫자로 1~6까지의 6 가지가 있습니다.
library(MASS)
##  선의 유형 : lty

# 자동차의 무게 Weight 별로 Cars93을 정렬합니다.
Cars93_order <- Cars93[order(Cars93$Weight), ]

par(mfrow = c(2, 3))

# plot layout by 2 row and 3 column
plot(MPG.highway ~ Weight, data = Cars93_order, type = "l", lty = 1, main = "lty = 1")
plot(MPG.highway ~ Weight, data = Cars93_order, type = "b", lty = 2, main = "lty = 2")
plot(MPG.highway ~ Weight, data = Cars93_order, type = "o", lty = 3, main = "lty = 3")
plot(MPG.highway ~ Weight, data = Cars93_order, type = "l", lty = 4, main = "lty = 4")
plot(MPG.highway ~ Weight, data = Cars93_order, type = "b", lty = 5, main = "lty = 5")
plot(MPG.highway ~ Weight, data = Cars93_order, type = "o", lty = 6, main = "lty = 6")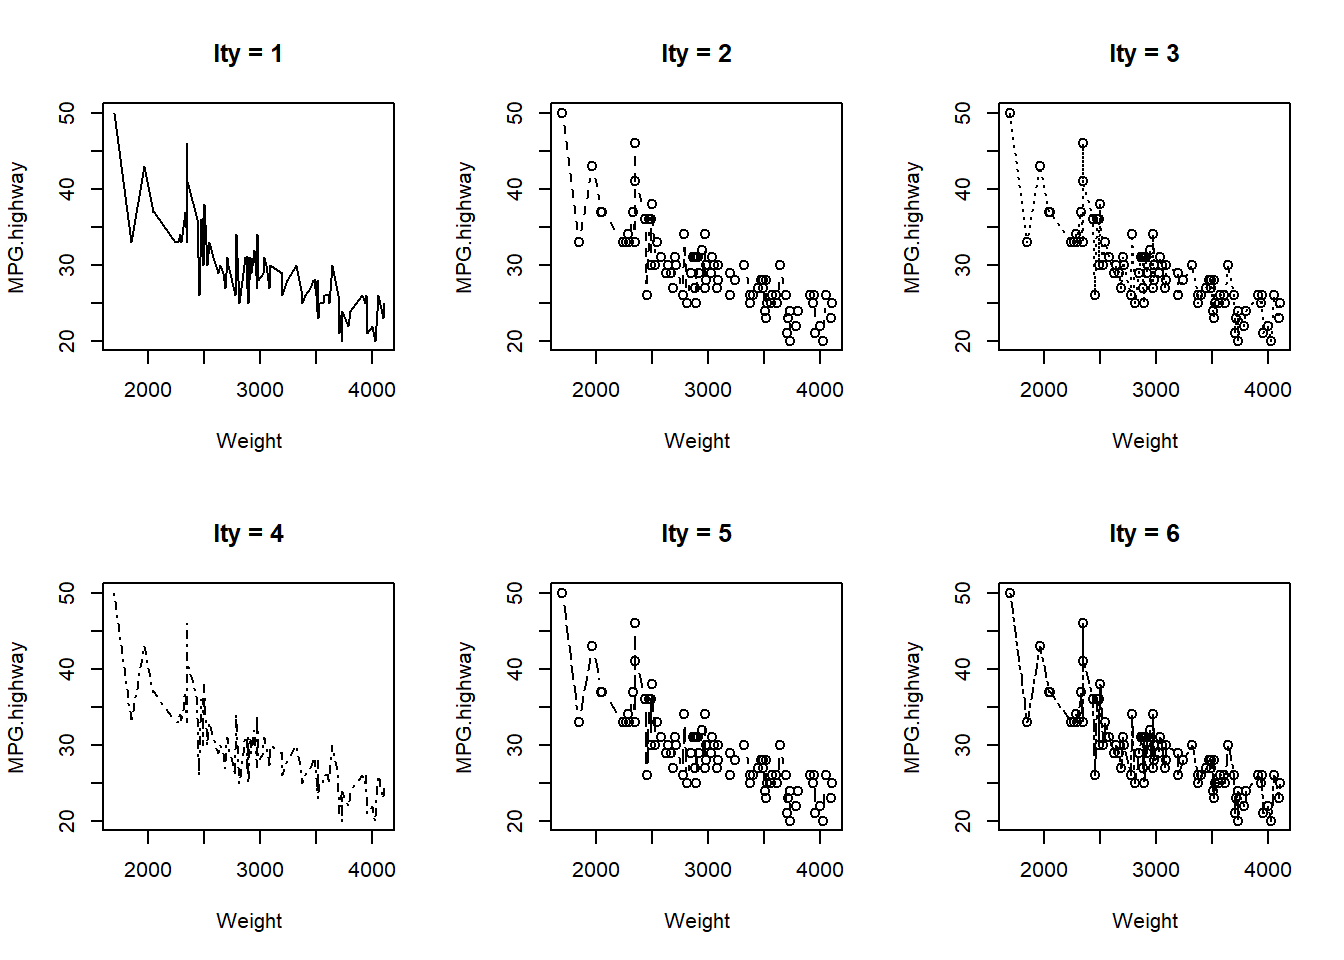
par(mfrow = c(1,1))21.2.4.2 선 두께 (line width) : lwd
선의 유형을 쓰기 위해서는 type =이 l , b 또는 o로 지정이 되어 있어야 합니다. 선 두께를 조절하는 그래프 모수는 lwd 입니다. lwd = 1 이 기본 값이며, 이 기본 값을 기준으로 숫자 만큼 선의 두께가 정해집니다. 아래에 lwd = 0.5, 1, 2, 3 별로 선 두께가 어떻게 변화하는지 예를 보겠습니다.
library(MASS)
##  선 두께 : lwd
# 자동차의 무게 Weight 별로 Cars93을 정렬합니다.
Cars93_order <- Cars93[order(Cars93$Weight), ]

# 화면을 2행 2열로 분할합니다.
par(mfrow = c(2, 2))

plot(MPG.highway ~ Weight, data = Cars93_order, type = "l", lwd = 0.5, main = "lwd = 0.5")
plot(MPG.highway ~ Weight, data = Cars93_order, type = "b", lwd = 1, main = "lwd = 1 (default)")
plot(MPG.highway ~ Weight, data = Cars93_order, type = "o", lwd = 2, main = "lwd = 2")
plot(MPG.highway ~ Weight, data = Cars93_order, type = "l", lwd = 3, main = "lwd = 3")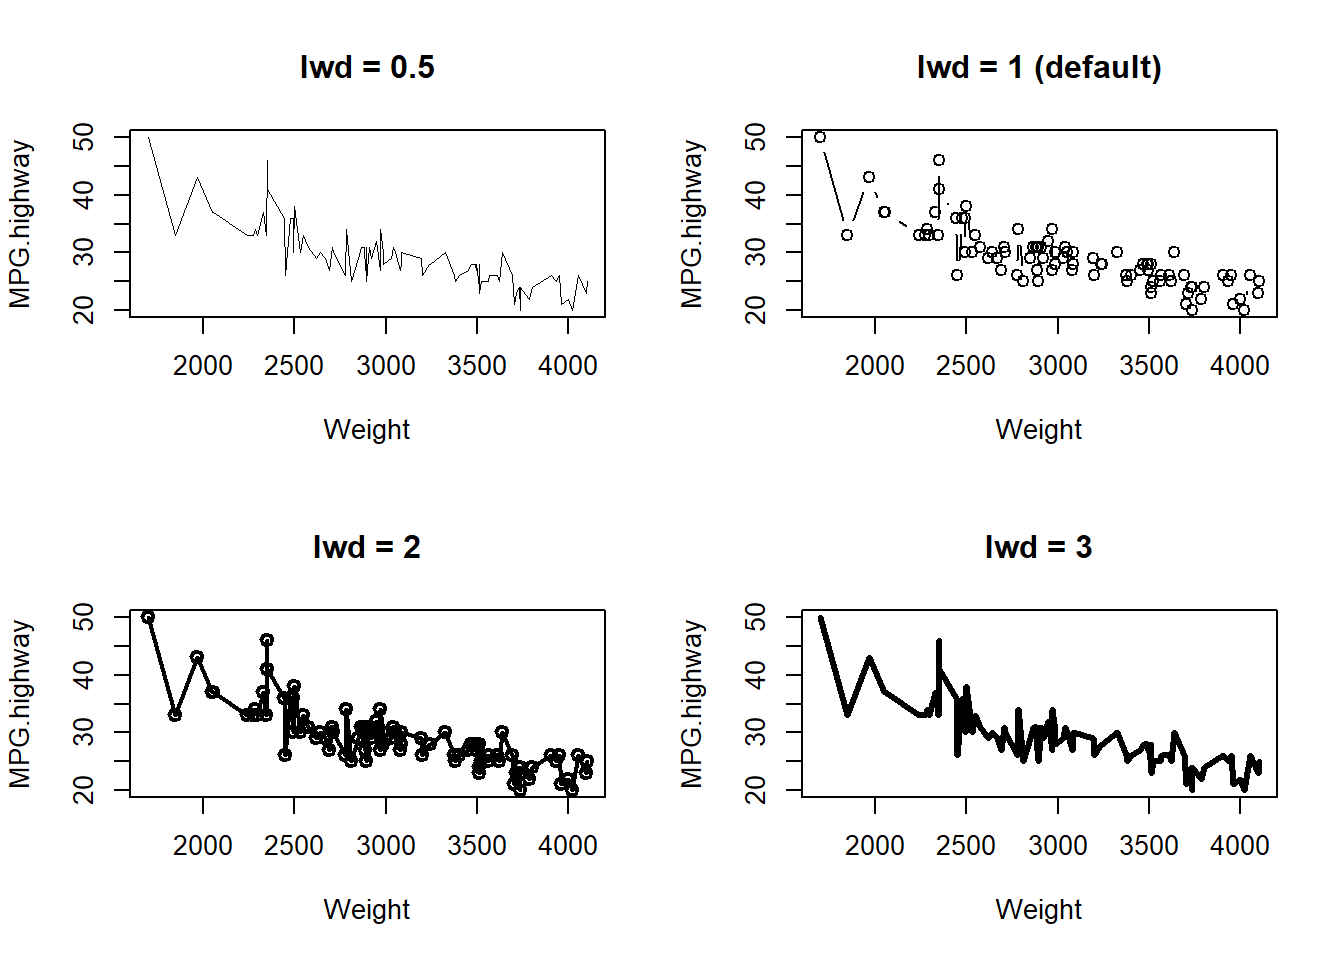
par(mfrow = c(1,1))