22.3 직선의 연결과 추가
이번 절에서는 낮은 수준의 그래프 함수 세 번째로 lines(x, y), abline(a, b), abline(h=y), abline(v=x) 등의 함수를 이용한 직선 연결 및 추가에 대해서 소개하겠습니다.
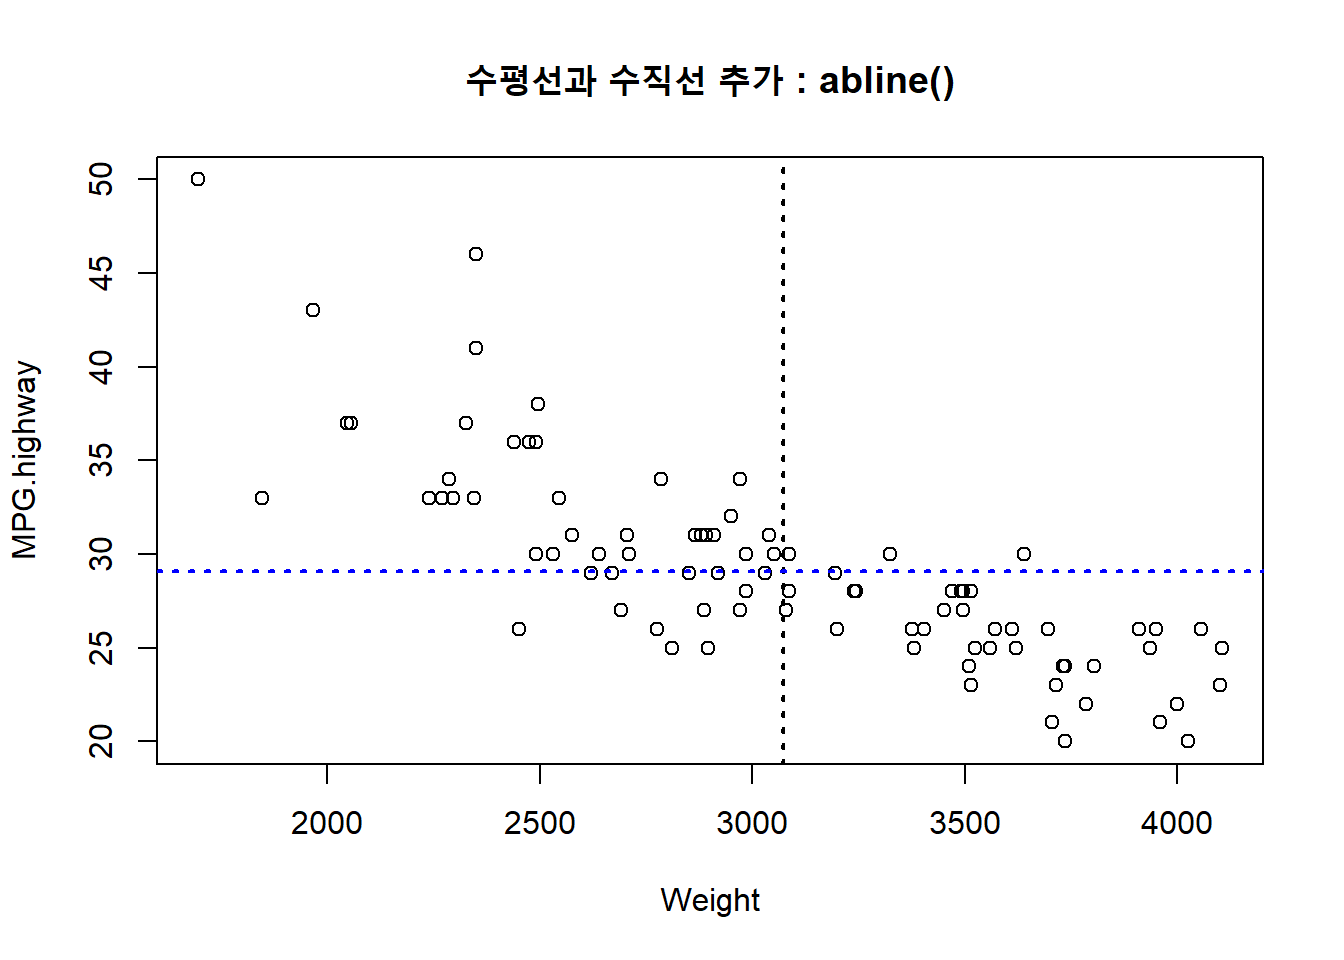
MASS 패키지에 들어있는 Cars93 데이터프레임의 **Weight (차의 무게)**와 **MPG.highway (고속도로 연비)** 두 개의 변수를 가지고 산포도를 그린 후에, **lines() 함수로 선형 회귀식을 추가해보고, abline() 함수로 x축과 y축의 평균으로 수직선과 수평선을 추가**하여 보겠습니다.
lines()함수의 일반적인 사용법은 다음과 같습니다.
lines(x, y = NULL, type = "l", ...)| 구분 | 기능 설명 |
|---|---|
x, y |
x, y 좌표 벡터 (coordinate vectors of points to join) |
type = "l" |
선(line) 그래프라는 뜻임 (character indicating the type of plotting) |
... |
선 유형 (lty), 선 색깔 (col), 선 두께(lwd) 등의 그래프 모수 입력 (Further graphical parameters) |
abline() 함수의 사용법은 다음과 같습니다.
abline(a = NULL, b = NULL, h = NULL, v = NULL, reg = NULL,
coef = NULL, untf = FALSE, ...) | 구분 | 기능 설명 |
|---|---|
a, b |
절편과 기울기, 단일 값 (the intercept and slope, single values) |
h |
y값을 지나는 수평인 직선 (the y-value(s) for horizontal line(s).) |
v |
x값을 지나는 수직인 직선 (the x-value(s) for vertical line(s).) |
reg |
회귀직선 추가 (an object with a coef method) |
coef |
절편과 기울기로 이루어진 벡터 (a vector of length two giving the intercept and slope) |
untf |
변환 안된 값을 쓸지를 묻는 옵션. 만약 y값을 로그변환한 경우 untf = TRUE 라고 설정하면 로그변환 전의 원래값 기준으로 좌표에 그래프가 그려짐 (logical asking whether to untransform.If untf is true, and one or both axes are log-transformed, then a curve is drawn corresponding to a line in original coordinates, otherwise a line is drawn in the transformed coordinate system. The h and v parameters always refer to original coordinates) |
* 출처 : http://sites.stat.psu.edu/~dhunter/R/html/graphics/html/abline.html
먼저 회귀모형을 구하는 lm() 함수를 사용해서 y = MPG.highway (고속도로 연비), x = Weight (차의 무게) 변수 간의 선형 회귀모형을 만들면 아래와 같습니다.
library(MASS)

##------------------------------------
## 플롯에 선을 추가합니다.
##------------------------------------

# 회귀 모형을 적용합니다.
str(Cars93)
## 'data.frame': 93 obs. of 27 variables:
## $ Manufacturer : Factor w/ 32 levels "Acura","Audi",..: 1 1 2 2 3 4 4 4 4 5 ...
## $ Model : Factor w/ 93 levels "100","190E","240",..: 49 56 9 1 6 24 54 74 73 35 ...
## $ Type : Factor w/ 6 levels "Compact","Large",..: 4 3 1 3 3 3 2 2 3 2 ...
## $ Min.Price : num 12.9 29.2 25.9 30.8 23.7 14.2 19.9 22.6 26.3 33 ...
## $ Price : num 15.9 33.9 29.1 37.7 30 15.7 20.8 23.7 26.3 34.7 ...
## $ Max.Price : num 18.8 38.7 32.3 44.6 36.2 17.3 21.7 24.9 26.3 36.3 ...
## $ MPG.city : int 25 18 20 19 22 22 19 16 19 16 ...
## $ MPG.highway : int 31 25 26 26 30 31 28 25 27 25 ...
## $ AirBags : Factor w/ 3 levels "Driver & Passenger",..: 3 1 2 1 2 2 2 2 2 2 ...
## $ DriveTrain : Factor w/ 3 levels "4WD","Front",..: 2 2 2 2 3 2 2 3 2 2 ...
## $ Cylinders : Factor w/ 6 levels "3","4","5","6",..: 2 4 4 4 2 2 4 4 4 5 ...
## $ EngineSize : num 1.8 3.2 2.8 2.8 3.5 2.2 3.8 5.7 3.8 4.9 ...
## $ Horsepower : int 140 200 172 172 208 110 170 180 170 200 ...
## $ RPM : int 6300 5500 5500 5500 5700 5200 4800 4000 4800 4100 ...
## $ Rev.per.mile : int 2890 2335 2280 2535 2545 2565 1570 1320 1690 1510 ...
## $ Man.trans.avail : Factor w/ 2 levels "No","Yes": 2 2 2 2 2 1 1 1 1 1 ...
## $ Fuel.tank.capacity: num 13.2 18 16.9 21.1 21.1 16.4 18 23 18.8 18 ...
## $ Passengers : int 5 5 5 6 4 6 6 6 5 6 ...
## $ Length : int 177 195 180 193 186 189 200 216 198 206 ...
## $ Wheelbase : int 102 115 102 106 109 105 111 116 108 114 ...
## $ Width : int 68 71 67 70 69 69 74 78 73 73 ...
## $ Turn.circle : int 37 38 37 37 39 41 42 45 41 43 ...
## $ Rear.seat.room : num 26.5 30 28 31 27 28 30.5 30.5 26.5 35 ...
## $ Luggage.room : int 11 15 14 17 13 16 17 21 14 18 ...
## $ Weight : int 2705 3560 3375 3405 3640 2880 3470 4105 3495 3620 ...
## $ Origin : Factor w/ 2 levels "USA","non-USA": 2 2 2 2 2 1 1 1 1 1 ...
## $ Make : Factor w/ 93 levels "Acura Integra",..: 1 2 4 3 5 6 7 9 8 10 ...# fitting regression model
fit.1 <- lm(MPG.highway ~ Weight, data = Cars93)다음으로, Weight (무게)와 MPG.highway (고속도로 연비)의 두 변수 산포도를 그리고, 위에서 만든 선형 회귀선을 추가해보겠습니다.
플롯에 선을 추가하는 데에는 세 가지 방법이 있습니다.
lines()함수를 사용하는 방법,abline(reg = )함수를 사용하는 방법,abline(a = coef[1], b = coef[2])를 사용하는 방법 등입니다.
참고로, 이렇게 추가되는 선에 대하여 그래프 모수(parameters)로서 색깔 지정은 col, 선 유형 지정은 lty, 선 두께 지정은 lwd 를 사용하면 됩니다.
library(MASS)
## 현재의 플롯에 선을 추가하는 방법입니다.

# (1) lines() 함수의 이용
with(Cars93, plot(MPG.highway ~ Weight))                    # Weight와 MPG.highway의 산점도를 그립니다.
lines(Cars93$Weight, fit.1$fitted.values, col = "blue")     # 산점도 위에 선을 추가합니다.
title("회귀선의 추가 : lines()") 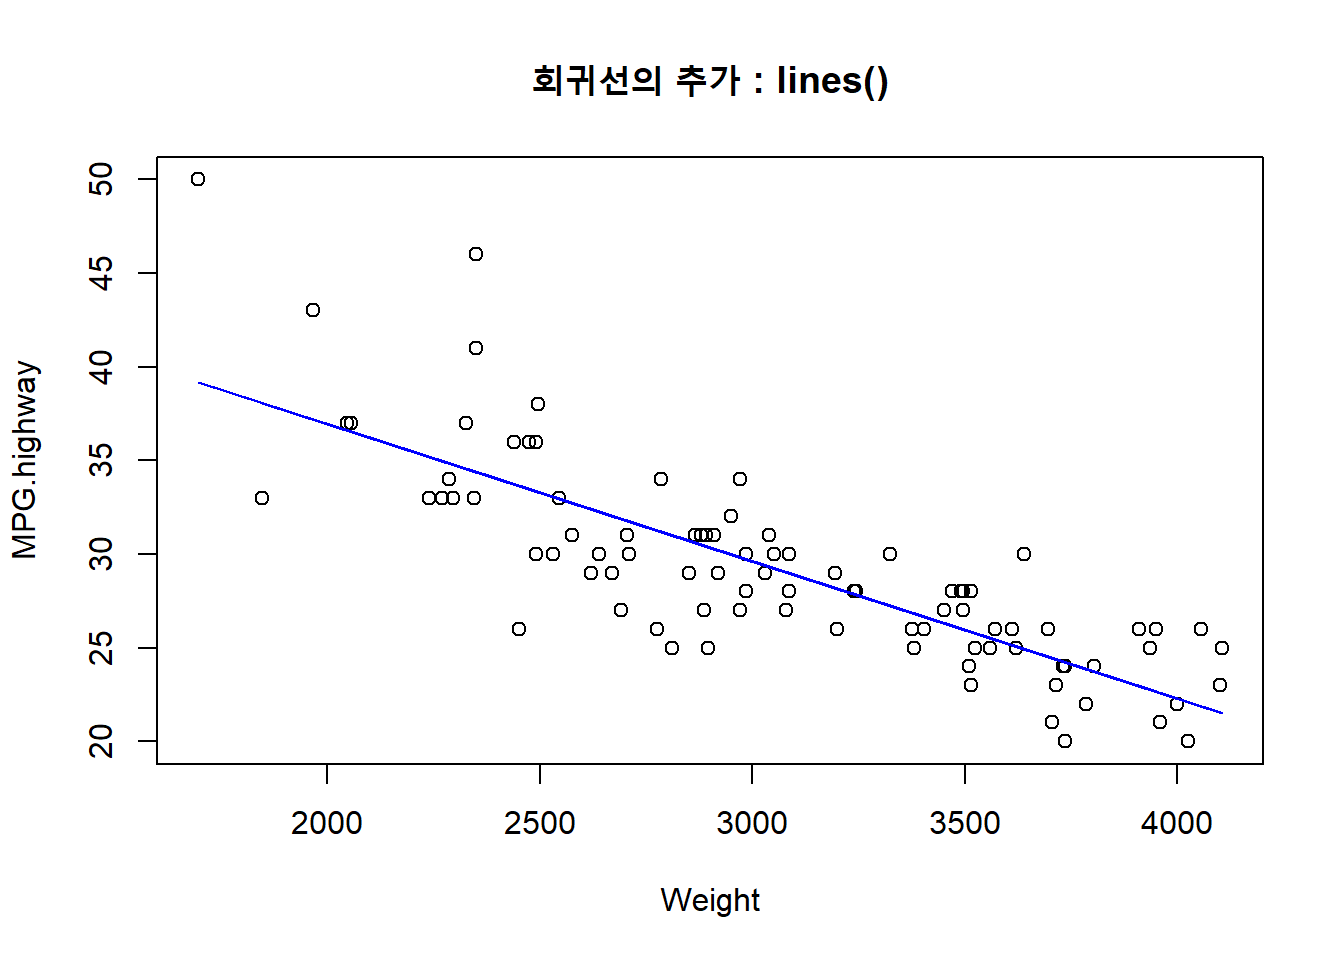
# (2) abline(reg = regression_model) 함수의 이용
with(Cars93, plot(MPG.highway ~ Weight))
abline(reg = fit.1, col = "red", lwd = 3)
title("회귀선의 추가 : abline(reg = )")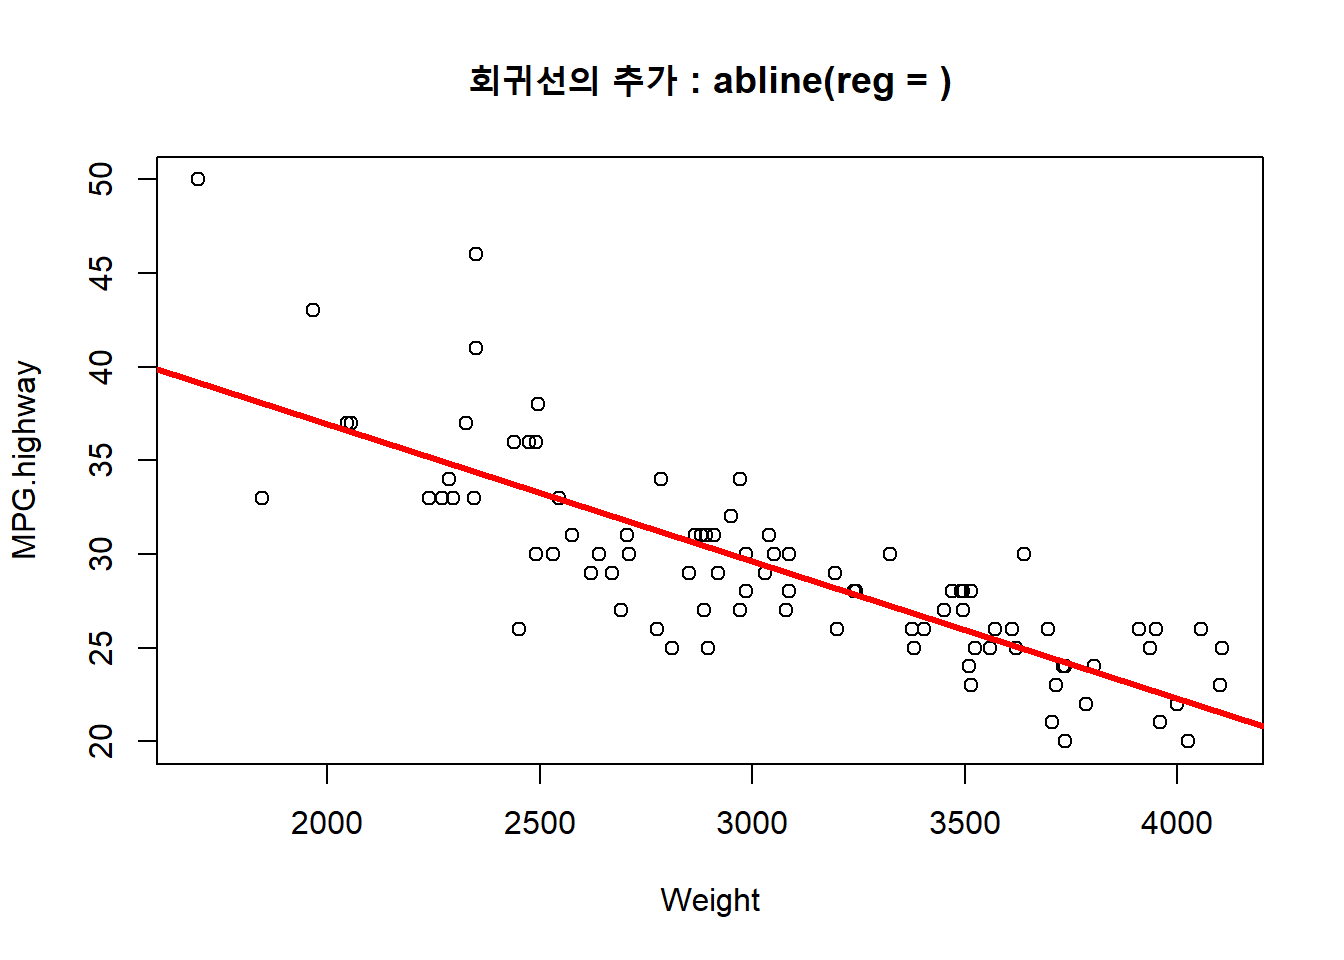
# (3) abline(a = fit.1$coef[1], b = fit.1$coef[2]) 함수의 이용
with(Cars93, plot(MPG.highway ~ Weight))
abline(a = fit.1$coef[1], b = fit.1$coef[2], col = "black", lwd = 3)
title("회귀선의 추가 : abline(a = coef[1], b = coef[2])")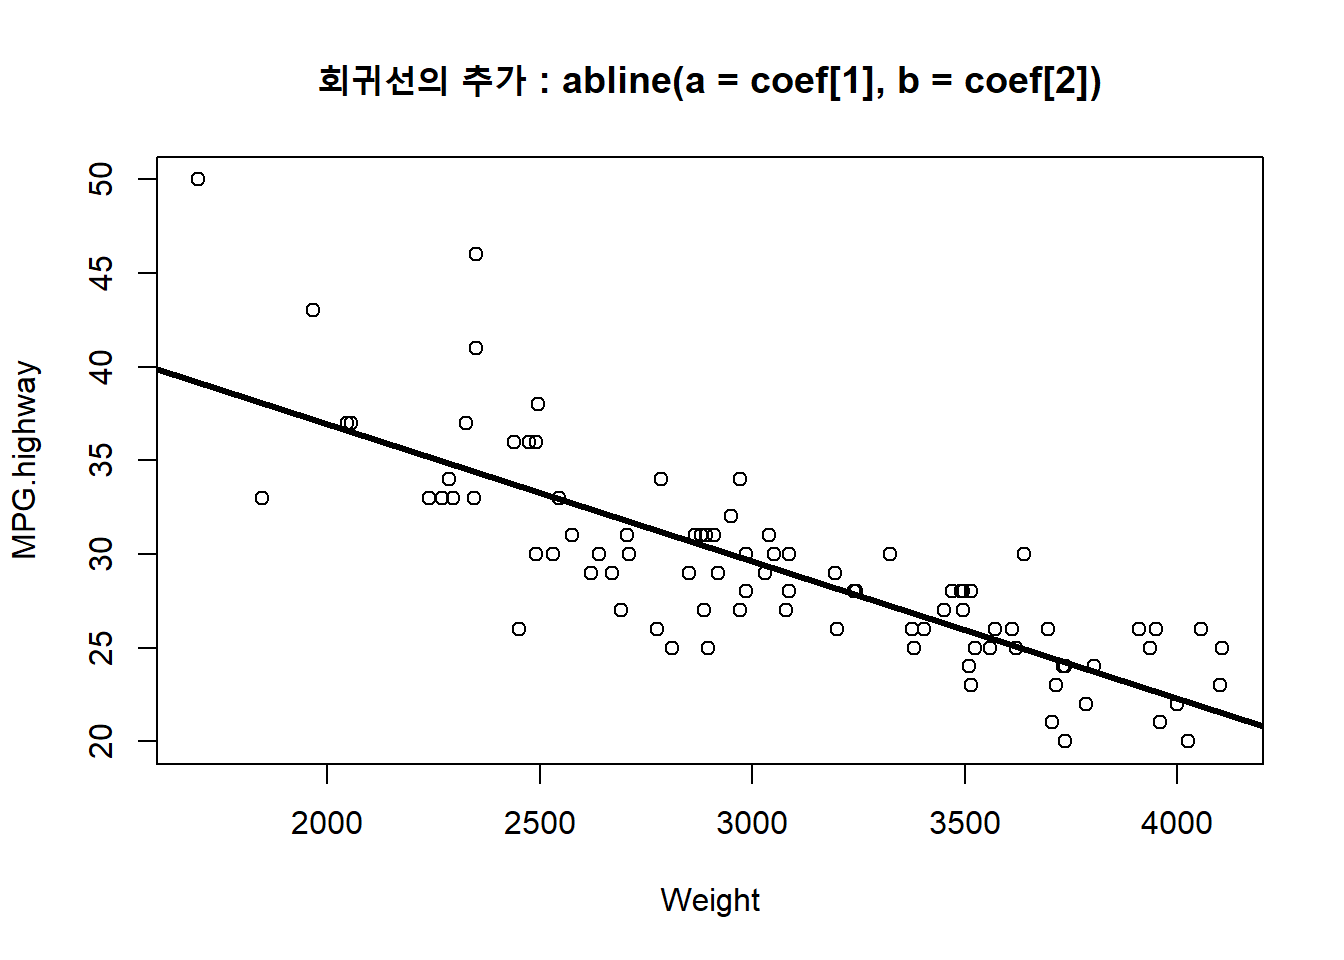
fit.1$coef # 회귀 모형의 계수(기울기와 절편)입니다.## (Intercept) Weight
## 51.601365429 -0.007327059fit.1$coef[1] # 절편입니다.## (Intercept)
## 51.60137fit.1$coef[2] # 기울기입니다.## Weight
## -0.007327059이번에는 loess.smooth() 함수로 비모수 회귀곡선을 적합시키고, lines() 함수로 평탄화된 회귀선(smoothed regression line)을 현재 그래프에 추가해보는 방법을 알아보겠습니다.
library(MASS)
## 현재의 플롯에 평탄화된 회귀선을 추가합니다.: lines(), loess.smooth()

# (1) 비모수 회귀선 적합화
fit.2 <- loess.smooth(x = Cars93$Weight, y = Cars93$MPG.highway)
names(fit.2)
## [1] "x" "y"fit.2$x ## [1] 1695.000 1744.184 1793.367 1842.551 1891.735 1940.918 1990.102 2039.286
## [9] 2088.469 2137.653 2186.837 2236.020 2285.204 2334.388 2383.571 2432.755
## [17] 2481.939 2531.122 2580.306 2629.490 2678.673 2727.857 2777.041 2826.224
## [25] 2875.408 2924.592 2973.776 3022.959 3072.143 3121.327 3170.510 3219.694
## [33] 3268.878 3318.061 3367.245 3416.429 3465.612 3514.796 3563.980 3613.163
## [41] 3662.347 3711.531 3760.714 3809.898 3859.082 3908.265 3957.449 4006.633
## [49] 4055.816 4105.000# (2) 평탄화된 회귄서의 추가
with(Cars93, plot(MPG.highway ~ Weight))
lines(fit.2$x, fit.2$y, col = "blue", lwd = 3)
title("평판화된 회귀선의 추가: lines(), loess.smooth()")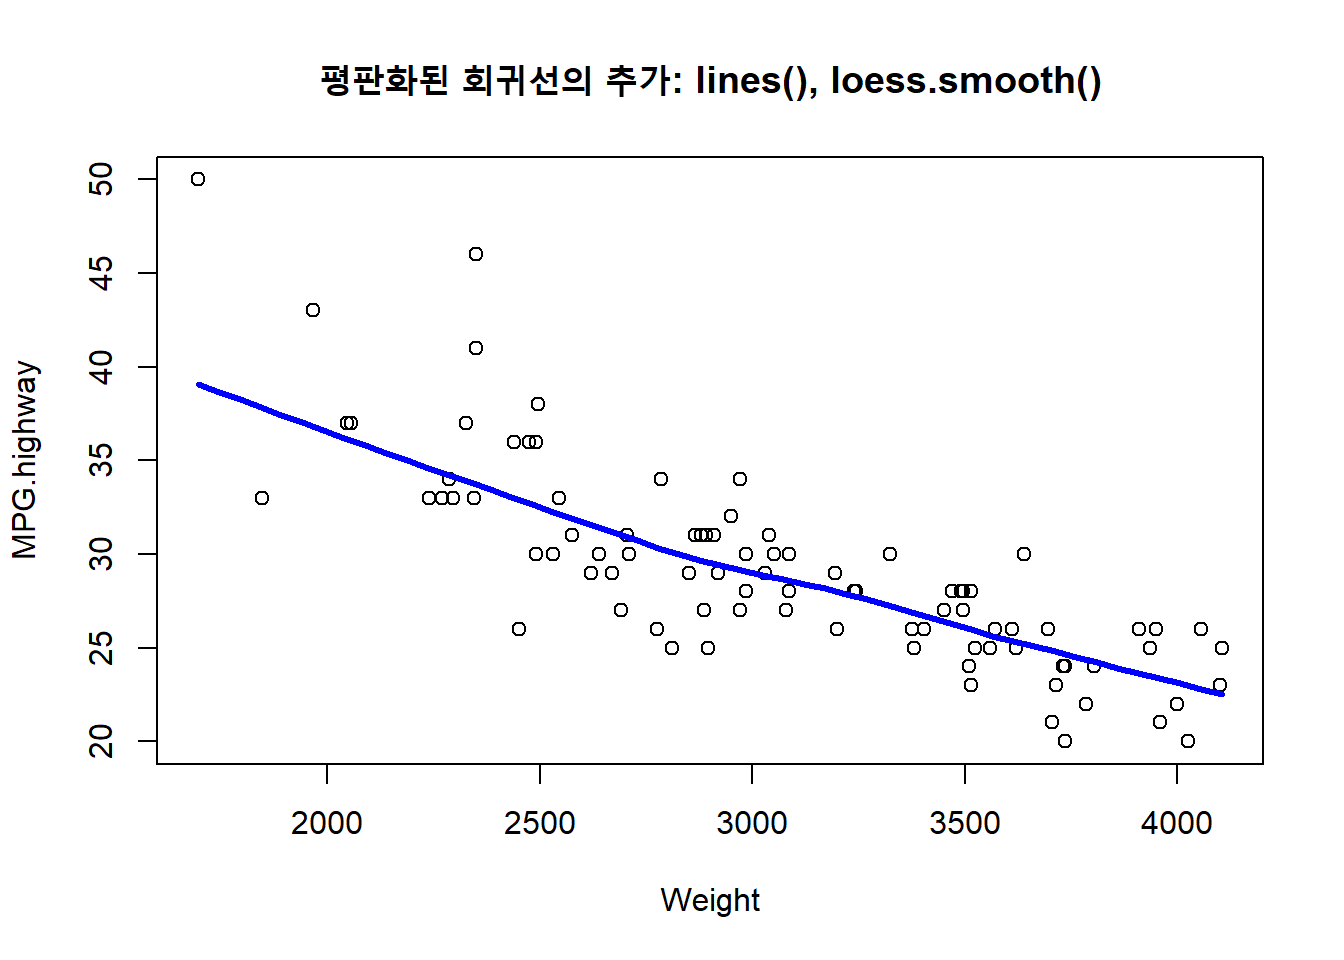
abline()함수를 이용하여 플롯에 수평선과 수직선을 추가할 수 있습니다.
library(MASS)
## 수평선과 수직선을 추가하기 : abline()

with(Cars93, plot(MPG.highway ~ Weight))
# (1) 수직선의 추가
abline(v = mean(Cars93$Weight), col = "black", lty = 3, lwd = 2)

# (2) 수평선의 추가
abline(h = mean(Cars93$MPG.highway), col = "blue", lty = 3, lwd = 2)

title("수평선과 수직선 추가 : abline()")