22.6 범례 추가 : legend(x, y, legend, ...)
이번 절에서는 낮은 수준의 그래프 함수 네번째로 legend(x, y, legend, ...) 함수를 이용하여 범례(legend)를 추가하는 방법에 대해 살펴보겠습니다.
범례를 추가하는 legend()함수의 일반적인 사용법은 아래와 같습니다.
legend(x, y = NULL, legend, fill = NULL, col = par("col"),
       border = "black", lty, lwd, pch,
       angle = 45, density = NULL, bty = "o", bg = par("bg"),
       box.lwd = par("lwd"), box.lty = par("lty"), box.col = par("fg"),
       pt.bg = NA, cex = 1, pt.cex = cex, pt.lwd = lwd,
       xjust = 0, yjust = 1, x.intersp = 1, y.intersp = 1,
       adj = c(0, 0.5), text.width = NULL, text.col = par("col"),
       text.font = NULL, merge = do.lines && has.pch, trace = FALSE,
       plot = TRUE, ncol = 1, horiz = FALSE, title = NULL,
       inset = 0, xpd, title.col = text.col, title.adj = 0.5,
       seg.len = 2)
플롯 위에 범례를 표시하기 위한 옵션도 엄청나게 많습니다. 그만큼 선택의 폭이 넓다는 것입니다.
이 절에서는 이 중에 몇 가지 중요한 옵션을 중심으로 살펴보겠습니다.
| 구분 | 옵션 | 기능 |
|---|---|---|
x, y |
"bottomright""bottom""bottomleft""left""topleft""top""topright""right""center" |
범례를 추가할 위치를 설정하는 3가지 방법 (1) x, y 좌표를 입력하면 범례 사각형의 왼쪽 상단이 그 지점에 위치함(2) locator(1)을 입력하면 마우스 포인터로 가리키는 지점에 범례 생성(3) 위치를 나타내는 아래의 9개 단어 중 하나를 선택해서 입력 |
legend |
길이가 1보다 큰 문자(character) 혹은 범례를 담은 벡터 | |
col |
색깔 지정 벡터 | |
lty |
선 유형 지정 벡터 | |
lwd |
선 두께 지정 벡터 | |
pch |
기호 지정 벡터 | |
... |
그래픽 모수 추가 설정 가능 |
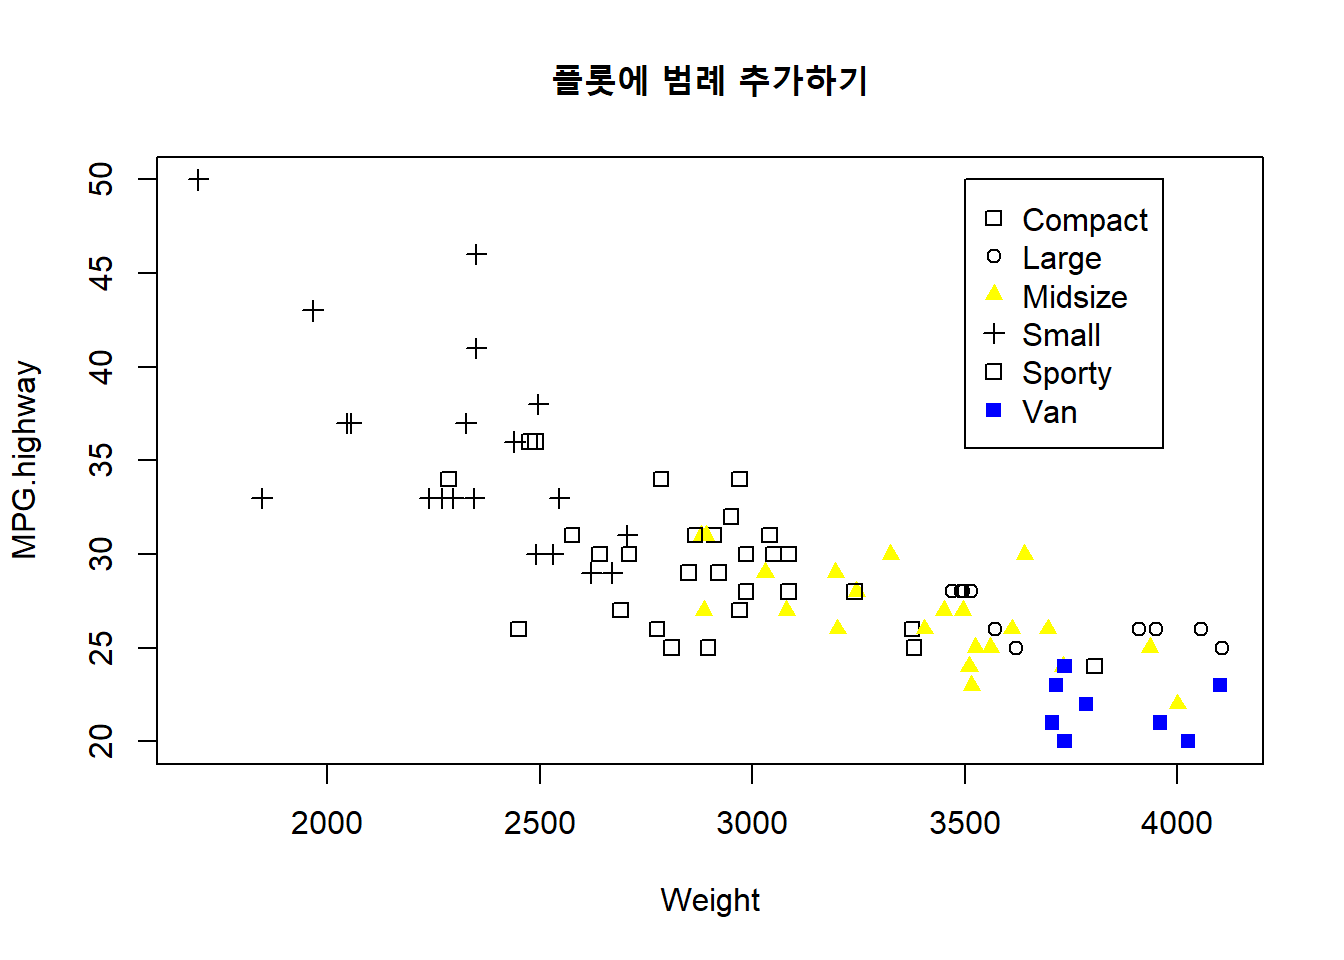
MASS 패키지에 내장된 Cars93데이터프레임의 차종(Type) 별로 차 무게(Weight)와 고속도로 연비 (MPG.highway) 변수를 사용해서 산점도를 그려보겠습니다. 그리고 차종(Type) 그룹에 대한 범례(legend)를 추가해보겠습니다.
22.6.1 x, y 좌표를 직접 입력하여 범례 위치 설정
library(MASS)

# 산점도를 먼저 그립니다.
attach(Cars93)
## The following object is masked _by_ .GlobalEnv:
##
## Cylinders## The following objects are masked from Cars93 (pos = 3):
##
## AirBags, Cylinders, DriveTrain, EngineSize, Fuel.tank.capacity,
## Horsepower, Length, Luggage.room, Make, Man.trans.avail,
## Manufacturer, Max.Price, Min.Price, Model, MPG.city, MPG.highway,
## Origin, Passengers, Price, Rear.seat.room, Rev.per.mile, RPM,
## Turn.circle, Type, Weight, Wheelbase, Width# 빈 산점도를 그립니다.
plot(Weight, MPG.highway, type = 'n') # blank plot
# 자동차의 종류(Type) 별로 산점도에 점으로 표시될 기호와 색깔을 다르게 선택합니다.
types <- levels(Type)
pchs <- c(0, 1, 17, 3, 0, 15)
cols <- c("black", "black", "yellow", "black", "black", "blue")
for (i in 1:6) { # for() 반복구문을 이용하여 차종별 점을 points() 함수로 그립니다.
points(Weight[Type == types[i]], MPG.highway[Type == types[i]],
pch = pchs[i],
col = cols[i])
}
title("플롯에 범례 추가하기") # 전체 제목을 표시합니다.
# 상단부 오른쪽("topright")에 범례를 추가합니다.
legend(x = 3500, y = 50,
types,
col = cols,
pch = pchs
) 
detach(Cars93)22.6.2 범례의 위치를 문자열로 지정하기
library(MASS)

# 산점도를 먼저 그립니다.
attach(Cars93)
## The following object is masked _by_ .GlobalEnv:
##
## Cylinders## The following objects are masked from Cars93 (pos = 3):
##
## AirBags, Cylinders, DriveTrain, EngineSize, Fuel.tank.capacity,
## Horsepower, Length, Luggage.room, Make, Man.trans.avail,
## Manufacturer, Max.Price, Min.Price, Model, MPG.city, MPG.highway,
## Origin, Passengers, Price, Rear.seat.room, Rev.per.mile, RPM,
## Turn.circle, Type, Weight, Wheelbase, Width# 빈 산점도를 그립니다.
plot(Weight, MPG.highway, type = 'n') # blank plot
# 범례가 표시될 위치를 문자열 키워드로 지정합니다.
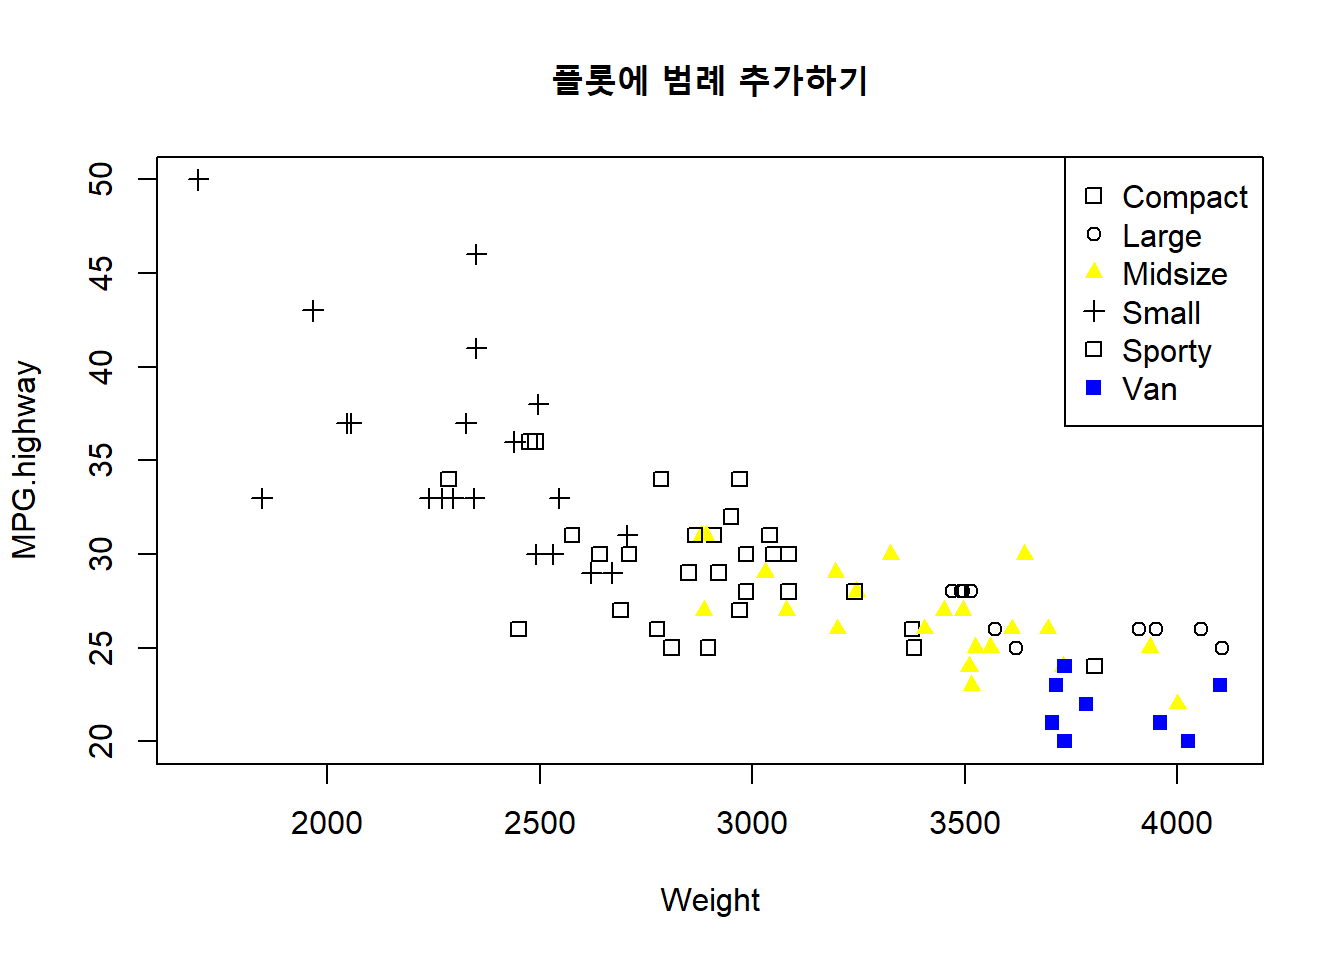
loc <- "topright"
# 자동차의 종류(Type) 별로 산점도에 점으로 표시될 기호와 색깔을 다르게 선택합니다.
types <- levels(Type)
pchs <- c(0, 1, 17, 3, 0, 15)
cols <- c("black", "black", "yellow", "black", "black", "blue")
for (i in 1:6) { # for() 반복구문을 이용하여 차종별 점을 points() 함수로 그립니다.
points(Weight[Type == types[i]], MPG.highway[Type == types[i]],
pch = pchs[i],
col = cols[i])
}
title("플롯에 범례 추가하기") # 전체 제목을 표시합니다.
# 상단부 오른쪽("topright")에 범례를 추가합니다.
legend(loc,
types,
col = cols,
pch = pchs
) 
detach(Cars93)앞의 예에서 문자열의 위치를 loc 변수에 “topright”로 지정하고 있습니다. 이 값을 다른 값으로 수정해서 다시 그래프를 그려보기 바랍니다.