9.3 Shiny 앱 사용자 지정
이 상용구 코드를 분석에 적합한 것으로 변경해 보자. 지금은 사용자 인터페이스를 약간 조정하고 데이터 세트를 구축하는 대신 데이터를 표시해 보기로 한다.
가장 먼저해야 할 일은 데이터 세트를 Shiny 폴더에 복사하여 향후 모든 자산과 함께 배포할 수 있도록 하는 것이다. R 명령 줄에서 다음 코드를 사용하여 데이터 세트를 Shiny 앱 폴더에 rdata 파일로 저장한다.
save(expectancy, file = "life_expectancy_web_app/expectancy.rdata")이제 앱이 시작될 때 이것을 Shiny 세션에 로드할 수 있다. Shiny app.R파일 상단에 코드를 넣어 데이터 세트를 불러온다.
load("expectancy.rdata")

expectancy <- expectancy %>%
                filter(!is.na(life_expectancy))
이렇게 하면 데이터 세트가 로드된 다음 히스토그램을 방해하는 결측치(missing values)가 제거된다. 이제 우리는 서버 구성 요소에서 한 줄의 코드를 변경하여 데이터 세트를 검토할 수 있다.
server <- function(input, output) {
                output$distPlot <- renderPlot({

                # generate bins based on

                # input$bins from ui.R

                x <- expectancy$life_expectancy
                bins <- seq(min(x), max(x), length.out = input$bins + 1)

                # draw the histogram with the

                # specified number of bins
                hist(x, breaks = bins,
                     col = 'darkgray',
                     border = 'white')
        })
}
이를 테스트하기 전에 제목 설명을 변경하고 플롯에 자체 색상을 추가해 보겠다. 이러한 변경을 수행할 위치를 짐작할 수 있다. 아래 코드에서 모든 변경 사항은 굵게 강조 표시된다.
library(shiny)
library(tidyverse)
load("expectancy.rdata")

expectancy <- expectancy %>%
        filter(!is.na(life_expectancy))

# Define UI for application that draws a histogram
ui <- fluidPage(
        # Application title
        titlePanel("Life Expectancy Data"),
        p("Life expectancy data was downloaded from
           data.gov. This dataset contains death rates
           and life-expectancy statistics
           from 1900 to 2015. Exploratory analysis was
           conducted on this dataset. In the
           visualization below, you can see all life
           expectancy rates in the dataset and adjust
           the number of bins used to present the
           frequency.
        "),

        # Sidebar with a slider input for number of bins
        sidebarLayout(
                sidebarPanel(
                        sliderInput("bins", "Number of bins:",
                                    min = 1,
                                    max = 50,
                                    value = 30)
                        ),
        # Show a plot of the generated distribution
        mainPanel(
                plotOutput("distPlot")
        )
    )
)

# Define server logic required to draw
# a histogram
server <- function(input, output) {
                output$distPlot <- renderPlot({
                # generate bins based on
                # input$bins from ui.R
                life_expectancy <- expectancy$life_expectancy
                bins <- seq(min(life_expectancy),
                            max(life_expectancy),
                            length.out = input$bins + 1)

                # draw the histogram with the
                # specified number of bins
                hist(life_expectancy,
                     breaks = bins,
                     col = 'lightblue',
                     border = 'white')
                })
}

# Run the application
shinyApp(ui = ui, server = server)
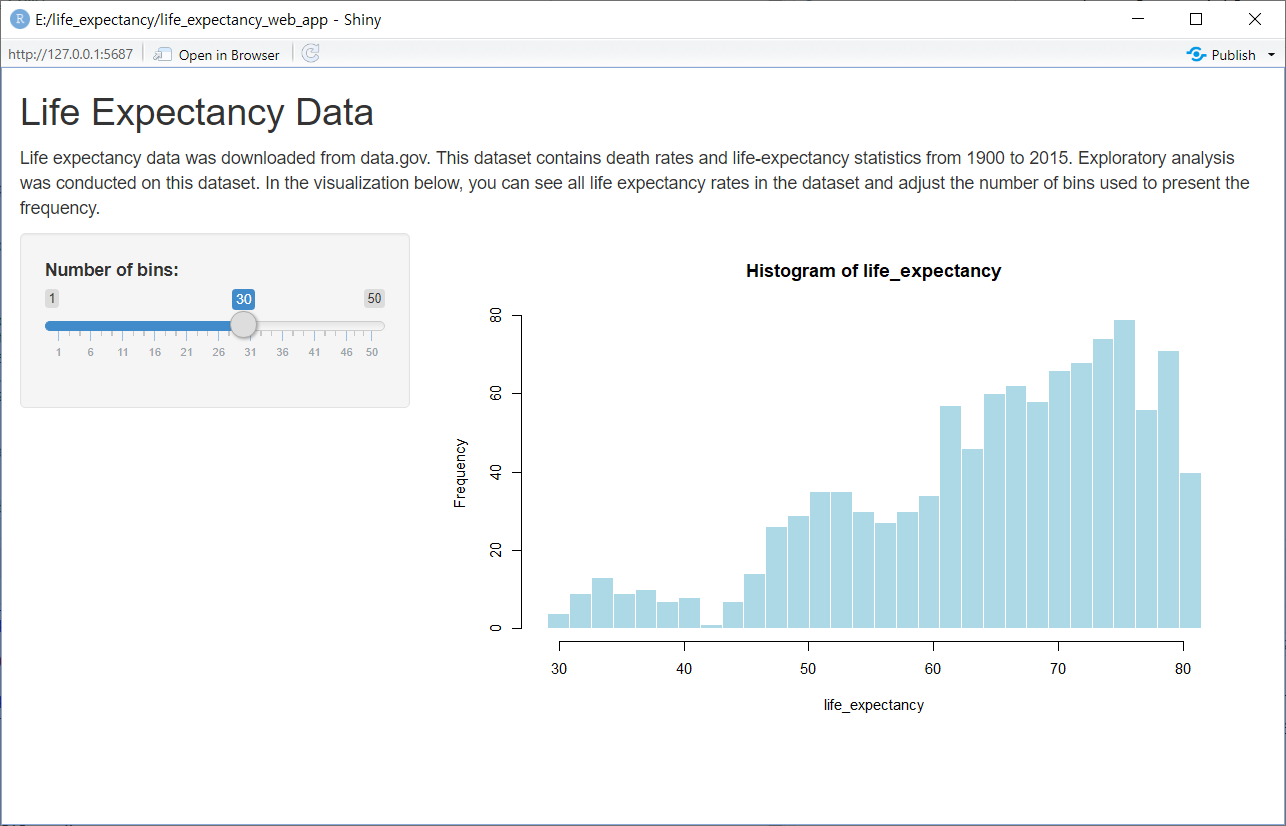
이제 이 코드를 실행하면 앱이 그림 9.5에 표시된 것과 비슷해진다.

그림 9.5: 기대 수명 Shiny 앱
이제 컨텍스트가 관련성이 있으며 히스토그램에서 막대의 색상도 조정했다. 다음 URL로 이동하면 작성자의 shiny.io 페이지에 게시된 버전을 볼 수 있다.