2.1 네트워크 생성(Create networks)
다음의 코드는 세 개의 에지(edge)를 갖는 무방향 그래프(undirected graph)를 생성한다. 정점(vertex, 노드) 안의 숫자들은 정점의 ID로 해석되며, 따라서 에지들은 1–>2, 2–>3, 3–>1 이다.
g1 <- graph( edges=c(1,2, 2,3, 3, 1), n=3, directed=F )
plot(g1)        # 단순한 네트워크 그림
class(g1)## [1] "igraph"g1## IGRAPH d0f3307 U--- 3 3 --
## + edges from d0f3307:
## [1] 1--2 2--3 1--3# 10개의 노드와 기본 값으로 방향성 네트워크
g2 <- graph( edges=c(1,2, 2,3, 3, 1), n=10 )
plot(g2)
g2## IGRAPH d0f663d D--- 10 3 --
## + edges from d0f663d:
## [1] 1->2 2->3 3->1g3 <- graph( c("John", "Jim", "Jim", "Jill", "Jill", "John")) # named vertices
plot(g3)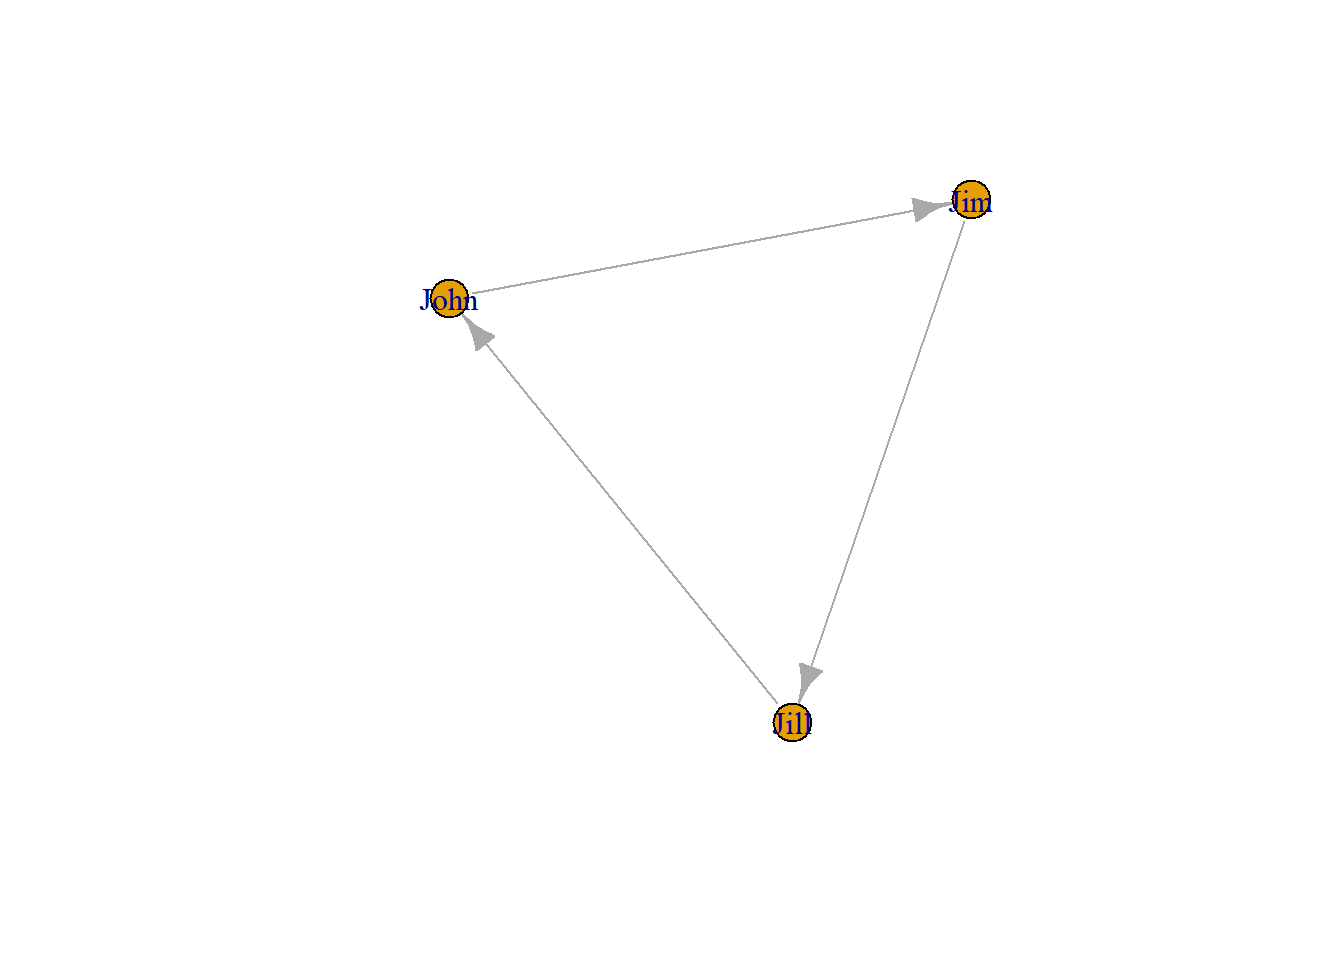
g3## IGRAPH d0fceeb DN-- 3 3 --
## + attr: name (v/c)
## + edges from d0fceeb (vertex names):
## [1] John->Jim Jim ->Jill Jill->Johng4 <- graph( c("John", "Jim", "Jim", "Jack", "Jim", "Jack", "John", "John"),
isolates=c("Jesse", "Janis", "Jennifer", "Justin") )
# In named graphs we can specify isolates by providing a list of their names.
plot(g4, edge.arrow.size=.5, vertex.color="gold", vertex.size=15,
vertex.frame.color="gray", vertex.label.color="black",
vertex.label.cex=0.8, vertex.label.dist=2, edge.curved=0.2) 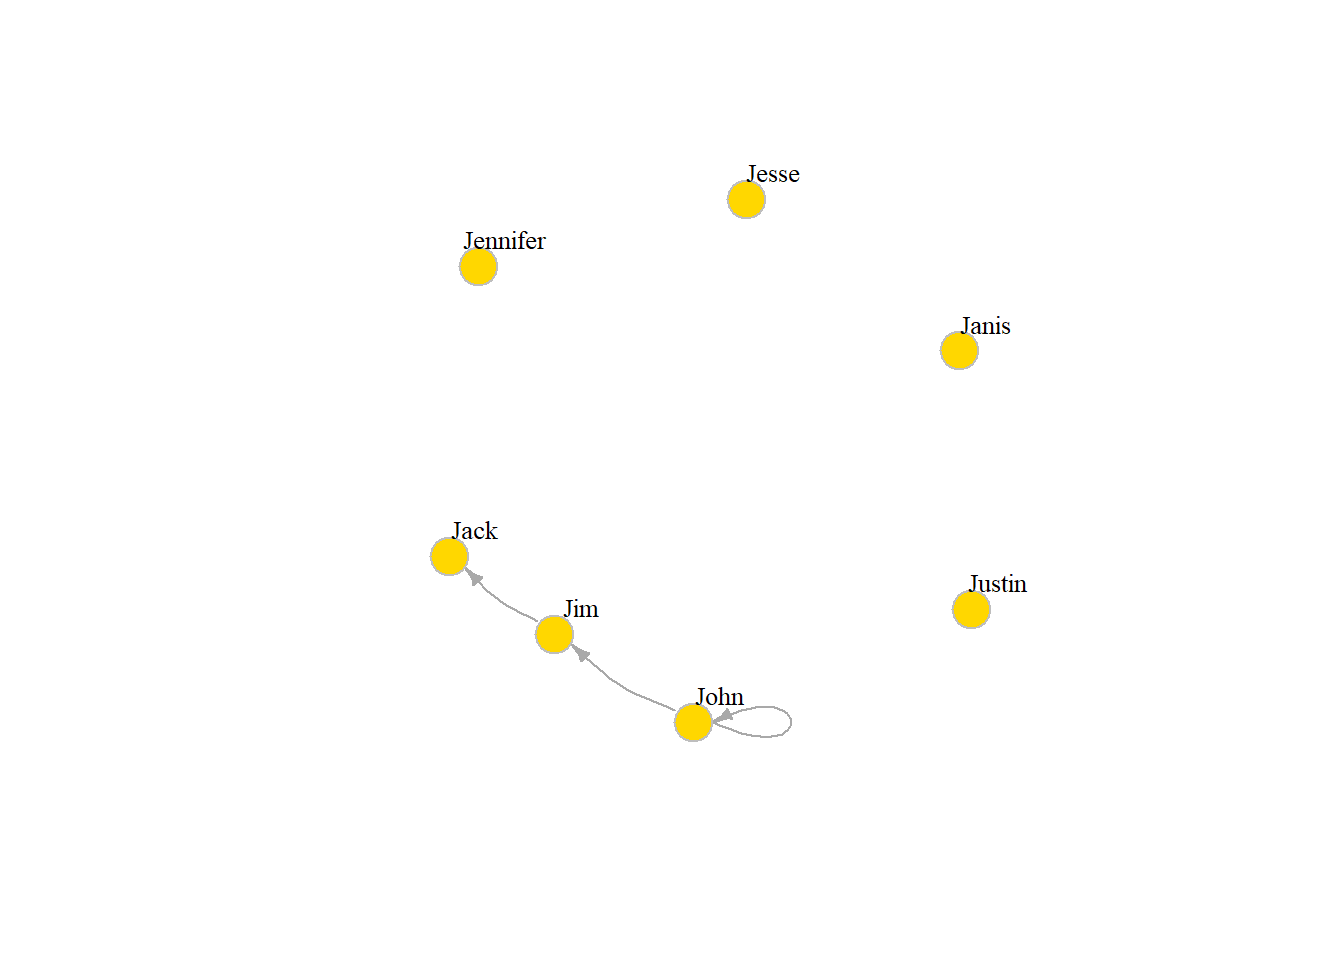
소규모의 그래프는 무방향 연결을 나타내는-, 왼쪽과 오른쪽을 나타내는 방향성 표현을 위한 +- 또는 -+ , 대칭형 연결을 위한 ++ 그리고 정점의 집합을 위한 “:” 등의 설명으로 생성할 수 있다.
plot(graph_from_literal(a---b, b---c)) # -의 갯수는 문제가 안됨
plot(graph_from_literal(a--+b, b+--c))
plot(graph_from_literal(a+-+b, b+-+c))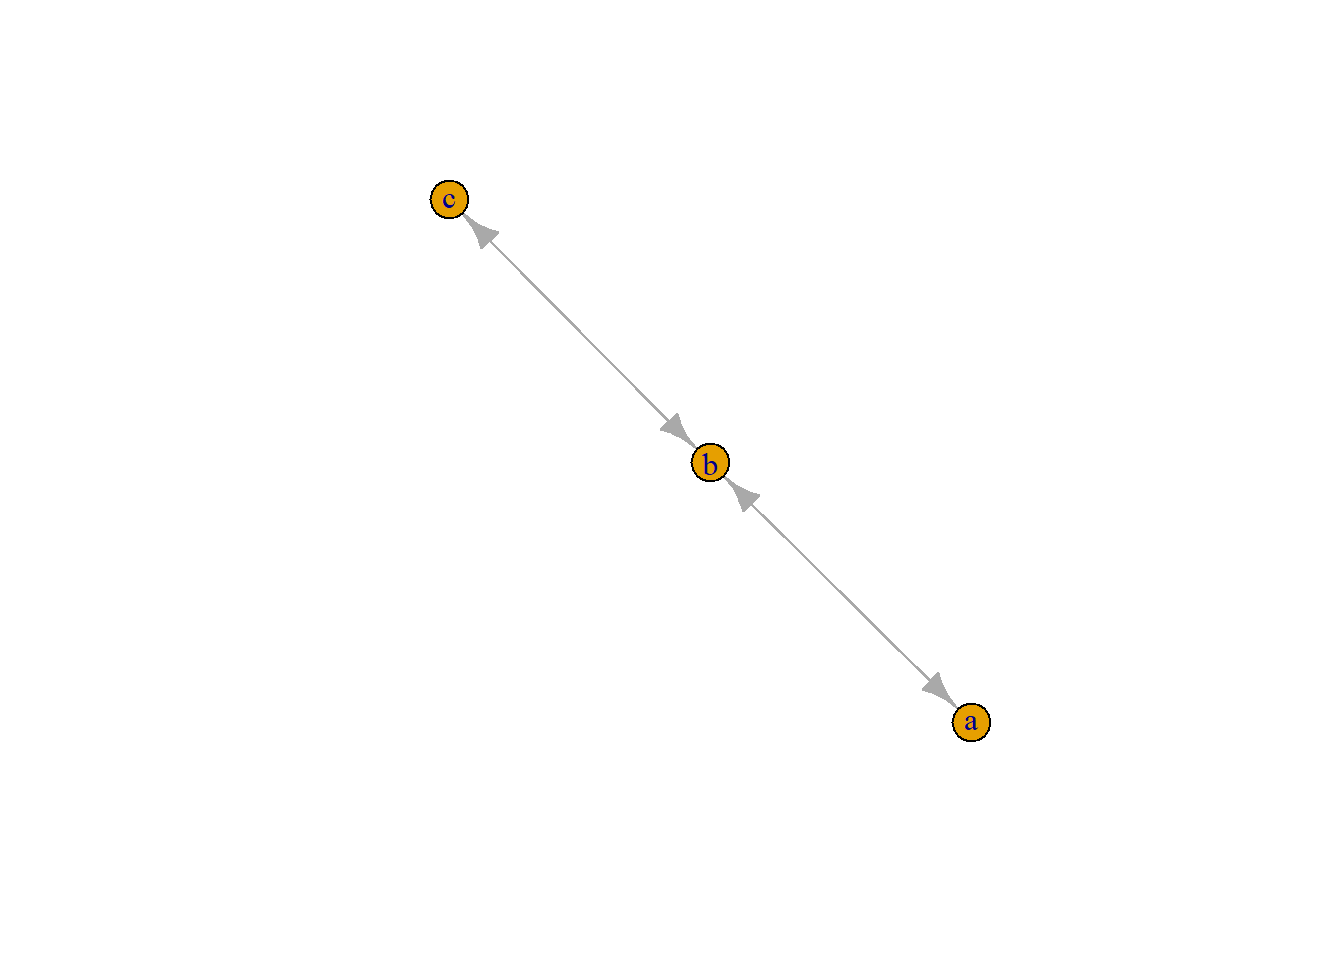
plot(graph_from_literal(a:b:c---c:d:e))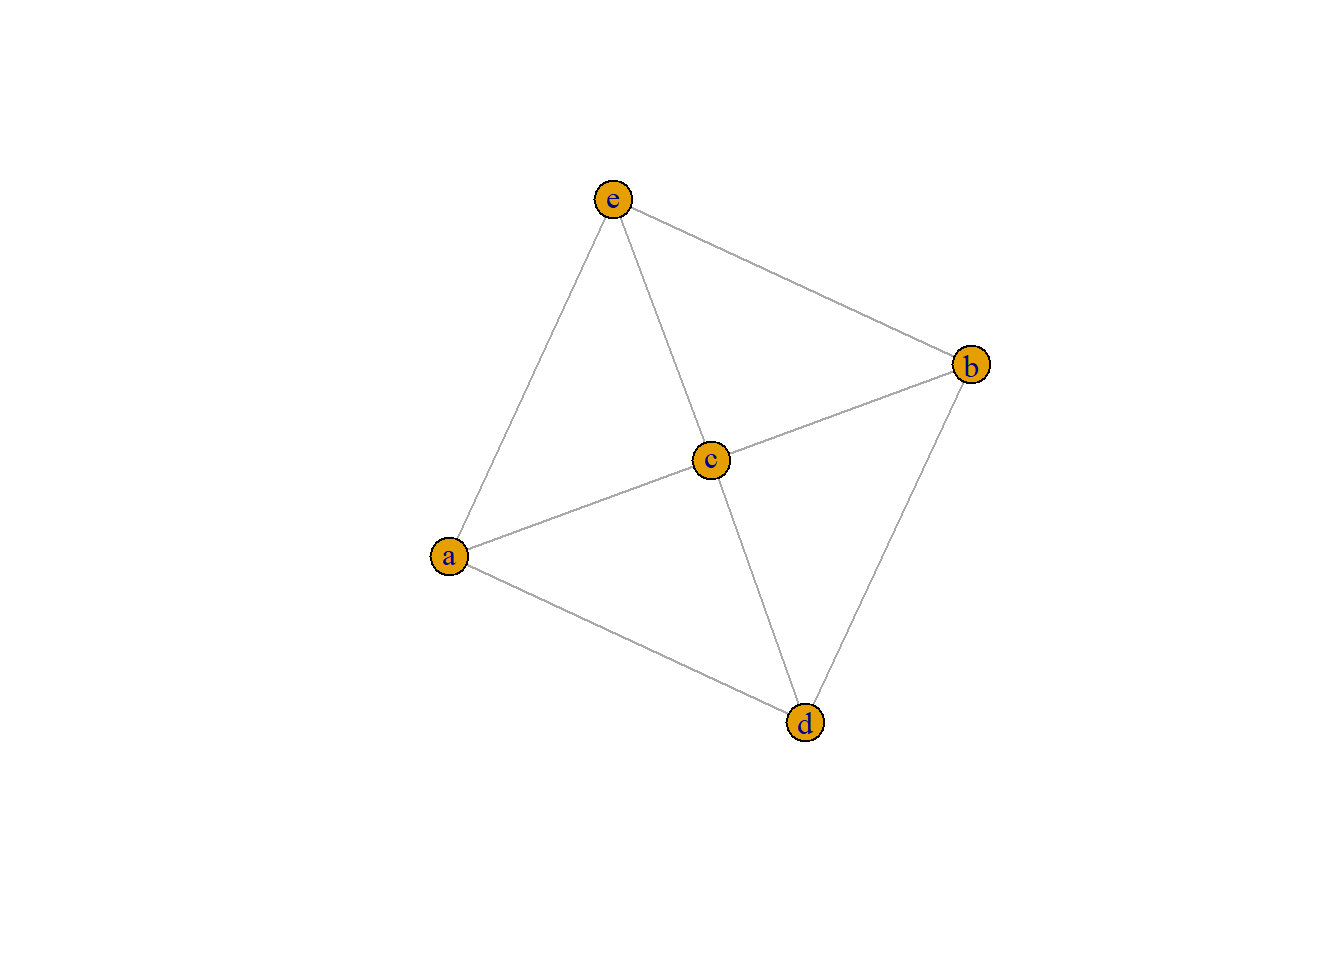
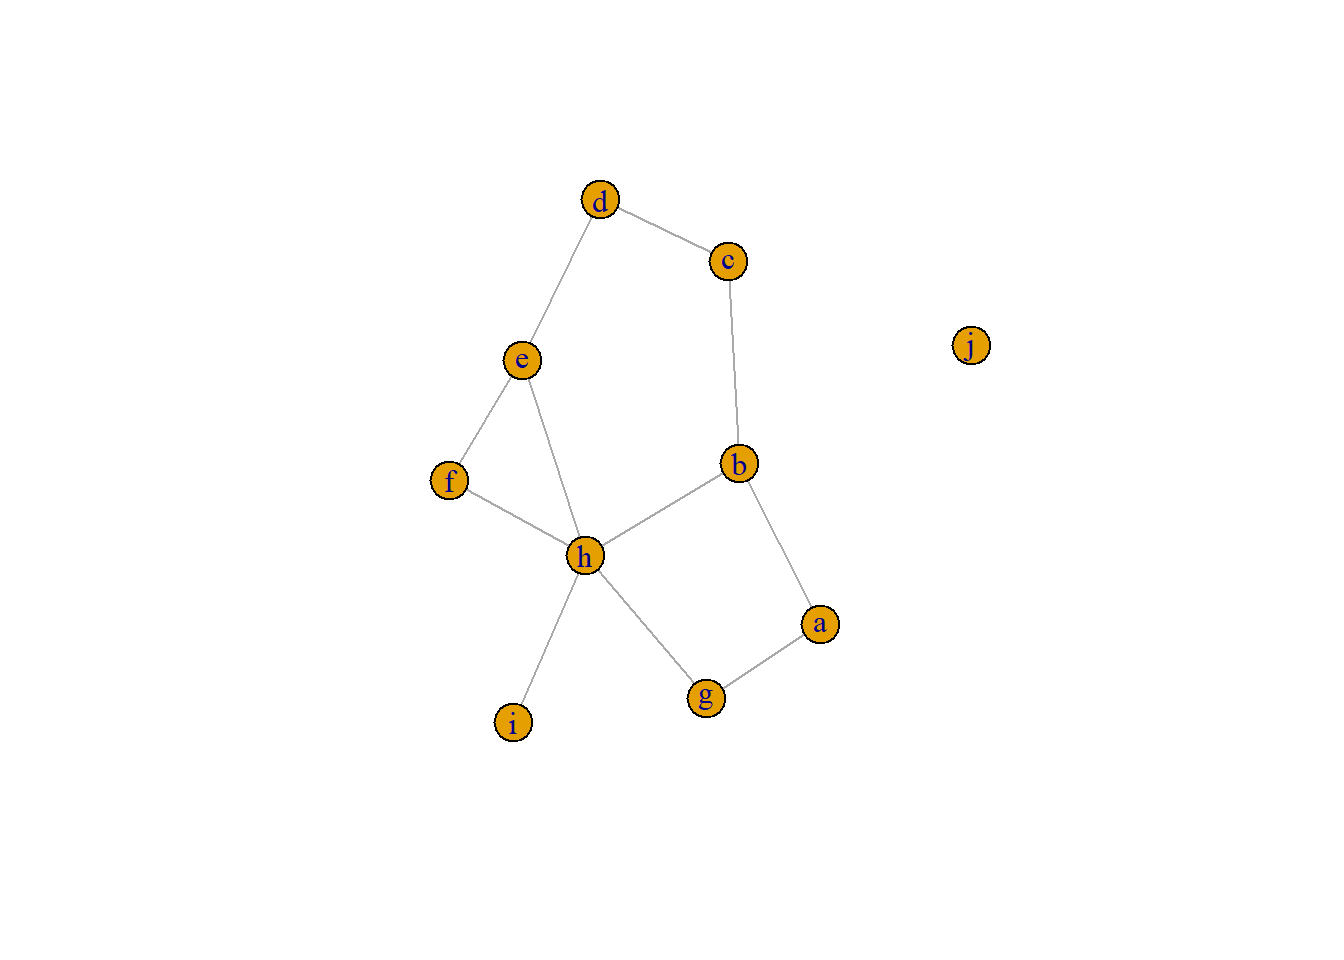
gl <- graph_from_literal(a-b-c-d-e-f, a-g-h-b, h-e:f:i, j)
plot(gl)