5.2 네트워크 시각화 개선
아직 네트워크의 시각화가 그렇게 도움이 되지 않음을 알 수 있다. 노드의 형태와 크기를 지정할 수 있지만, 우리가 검토하고 있는 연결들이 너무 조밀해서 그 구조를 그렇게 잘 파악하기가 쉽지 않다. 이를 위한 하나의 접근방법은 가장 중요한 연결에만 집중하고 나머지는 제거함으로써 네트워크를 간소화할 수 있는지를 알아보는 것이다.
hist(links$weight)
mean(links$weight)## [1] 12.40816sd(links$weight)## [1] 9.905635중요한 에지들을 추출하는 좀 더 복잡한 방법이 있지만 여기서는 네트워크의 평균 가중치 보다 더 큰 가중치를 갖는 노드들만 집중하기로 한다.
igraph 패키지에서는 delete_edges(net, edges) 함수를 이용하여 에지들을 삭제할 수 있다 :
cut.off <- mean(links$weight)
net.sp <- delete_edges(net, E(net)[weight < cut.off])
plot(net.sp) 
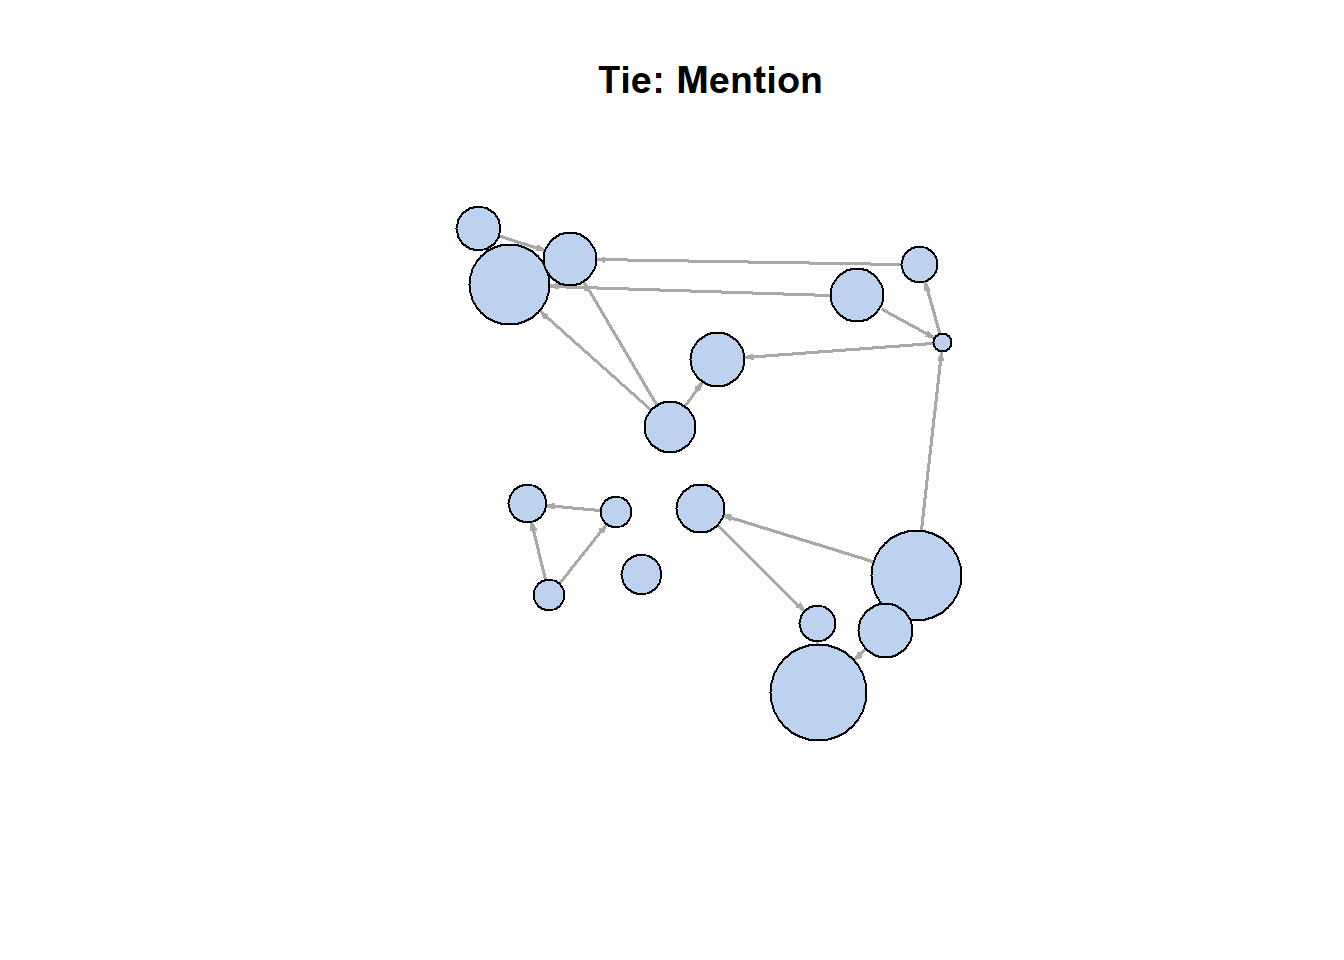
이에 대한 또 다른 고려 방법은 두 개의 연결 유형(hyperlink와 mention)을 따로 시각화하는 것이다.
E(net)$width <- 1.5

plot(net, edge.color=c("dark red", "slategrey")[(E(net)$type=="hyperlink")+1],
     vertex.color="gray40", layout=layout.circle)
두 개의 link들을 따로 플롯하기 :
net.m <- net - E(net)[E(net)$type=="hyperlink"] # another way to delete edges
net.h <- net - E(net)[E(net)$type=="mention"]

# 두 개의 link를 따로 시각화하기
par(mfrow=c(1,2))
plot(net.h, vertex.color="orange", main="Tie: Hyperlink")
plot(net.m, vertex.color="lightsteelblue2", main="Tie: Mention")
두 개의 플롯에서 존재하는 노드들을 확인하기 :
l <- layout_with_fr(net)
plot(net.h, vertex.color="orange", layout=l, main="Tie: Hyperlink")
plot(net.m, vertex.color="lightsteelblue2", layout=l, main="Tie: Mention")
dev.off()## null device
## 1