3 Base Graphics의 주요 함수
hist()boxplot()stem()barplot()dotchart()pie()plot()
각 함수에 대한 사용방법은
? 함수명또는?? 함수명으로 확인할 수 있다.
- (예,
? hist,?? stem)
R의 plotting system에는 크게 (1) Base Graphics, (2) Lattice, (3) ggplot2 의 3가지가 있습니다. 이전 장에서 ggplot2 plotting system을 활용한 그래프 그리기를 간단히 소개하였다면, 이제부터는 쉽고 빠르게, 대화형으로 직관적으로 그래프를 단계적으로 그려나갈 수 있는 Base Graphics plotting system에 대해서 알아보겠습니다.
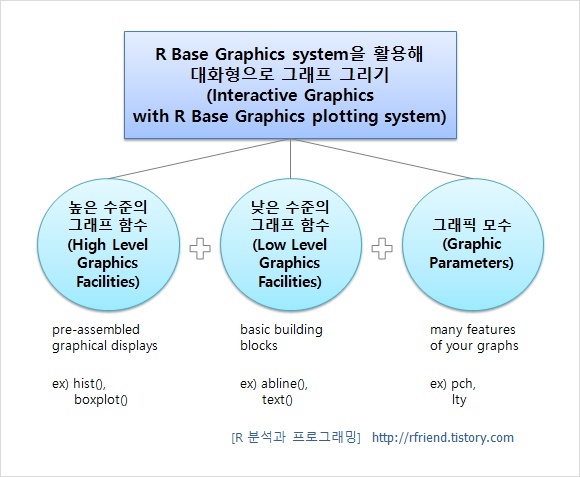
Base Graphics system 은 그래프의 기본 뼈대에 해당하는 (1) 높은 수준의 그래프 함수 (High Level Graphics facilities), 여기에 살을 하나, 둘씩 차근 차근 더해가는 (2) 낮은 수준의 그래프 함수 (Low Level Graphics facilities), 색깔이나 모양, 선 형태, 마진 등의 다양한 그래프 특성에 해당하는 옵션을 설정하는 (3) 그래픽 모수 (Graphic Parameters) 를 조합하여 단계적으로 (step by step) 그래프를 대화형으로 그려나가게 됩니다.

Figure 3.1: Base Graphics system
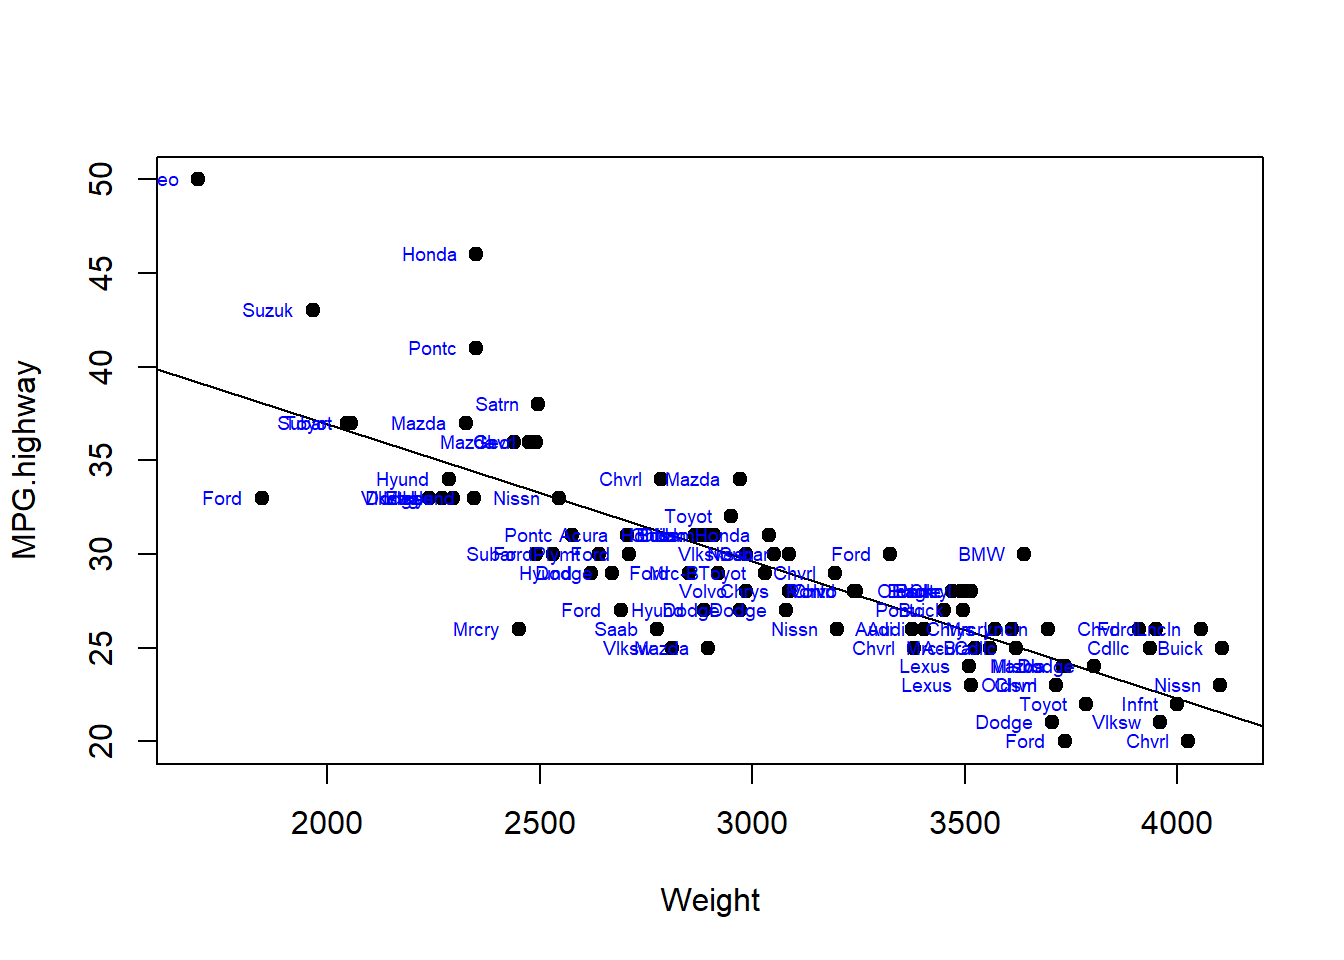
아래에 산포도(scatter plot)를 가지고 위에서 소개한 용어들이 의미하는 바를 예를 들어 설명해보도록 하겠습니다.
library(MASS)
attach(Cars93)
## The following object is masked _by_ .GlobalEnv:
##
## Cylinders# 1. high level graphics facility : plot()
# graphics parameters : type, pch, col, etc.
plot(MPG.highway ~ Weight, type = "p", pch = 19, col = "black")
# 2. low level graphics facility : abline(), title(), text()
# 3. graphics parameters : labels, cex, pos, col, etc.
abline(lm(MPG.highway ~ Weight))
text(Weight, MPG.highway, labels = abbreviate(Manufacturer, minlength = 5),
cex = 0.6, pos = 2, col = "blue")
Figure 3.2: base Graphics의 그래프 예
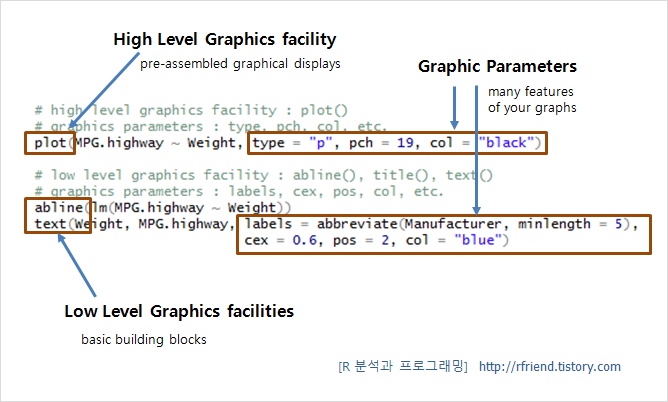
detach(Cars93)위 그래프의 R함수에서 높은 수준의 그래프 함수, 낮은 수준의 그래프 함수, 그래프 모수에 해당하는 부분을 각 각 표기하면 아래와 같습니다.
- 높은 수준의 그래프 함수
plot()으로 먼저 뼈대를 잡아놓고, - 낮은 수준의 그래프 함수
abline()로차의 무게(Weight)와고속도로연비(MPG.highway)간 회귀선을 적합시킨 선을 추가하고text()로차 제조사 이름(Manufacturer)을 명기하였습니다. - 이때 그래프 모수(parameters)로
그래프의 형태(type),점의 형태(pch),색깔(col),레이블(labels),default 대비 확대 배수(cex),다른 축과 교차되는 좌표(pos)등을 옵션으로 설정하게 됩니다.

Figure 3.3: R 스크립트의 그래프 구성 요소
주요한 높은 수준의 그래프 함수 (High Level Graphics facilities) 들을 표로 정리해보면 아래의 표 3.1와 같습니다.
| 그래프 | 높은 수준의 그래프 함수 |
|---|---|
| Histogram | hist() |
| Box-and-Whiskers Plot | boxplot() |
| Stem and Leaf Plot | stem() |
| Bar Plot | barplot() |
| Cleveland Dot Plot | dotchart() |
| Pie Plot | pie() |
| Scatter Plot | plot() |
| Scatter Plot Matrix | plot() |
| " | scatterplotMatrix() |
| Line Plot | plot(x, y, type = ‘l’) |
| Hige Density Needle Plot | plot(x, y, type = ‘h’) |
| Both Dot and Line Plot | plot(x, y, type = ‘b’) |
| Overlapped Dot and Line Plot | plot(x, y, type = ‘o’) |
| Step Plot | plot(x, y, type = ‘s’) |
| Empty Plot | plot(x, y, type = ‘n’) |