5.2 기호
지난 절에서 R 그래프 모수 (Graphical Parameters)를 설정하는 2가지 방법에 대해서 소개하였습니다.
이번 절에서는 기호와 관련한 설정에 대하여 하나씩 살펴 보겠습니다.
그래프 모수가 70여 가지가 되므로 모두를 설명하기에는 무리가 있으며, 자주 사용하는 것들 위주로 선별해서 소개합니다.
? par 로 도움말을 찾아보시면 모든 그래프 모수에 대한 도움말을 검색할 수 있습니다.
특히, type = 모수는 다음과 같은 플롯의 종류를 선택할 수 있게 해 줍니다.
| 옵션 | 플롯의 형태 |
|---|---|
| p | 점 |
| l | 선 |
| b | 점과 선을 동시에 |
| c | “b”의 선 부분 (점은 생략) |
| o | 점과 선을 중첩해서 그림(overplotted) |
| h | 히스토그램과 같이 수직선 그리기 |
| s | 계단 모양으로 연결한 그래프 |
| S | 또 다른 계단 모양 그래프 |
| n | 플롯팅을 하지 않음 |
참고로 type = 모수에 대한 그래프의 형태는 다음의 그림 5.6 과 같습니다.
par(mfrow = c(3,3))


plot(Cars93$MPG.highway, type = "p", main = "type = \"p\"")
plot(Cars93$MPG.highway, type = "l", main = "type = \"l\"")
plot(Cars93$MPG.highway, type = "b", main = "type = \"b\"")
plot(Cars93$MPG.highway, type = "c", main = "type = \"c\"")
plot(Cars93$MPG.highway, type = "o", main = "type = \"o\"")
plot(Cars93$MPG.highway, type = "h", main = "type = \"h\"")
plot(Cars93$MPG.highway, type = "s", main = "type = \"s\"")
plot(Cars93$MPG.highway, type = "S", main = "type = \"S\"")
plot(Cars93$MPG.highway, type = "n", main = "type = \"n\"") 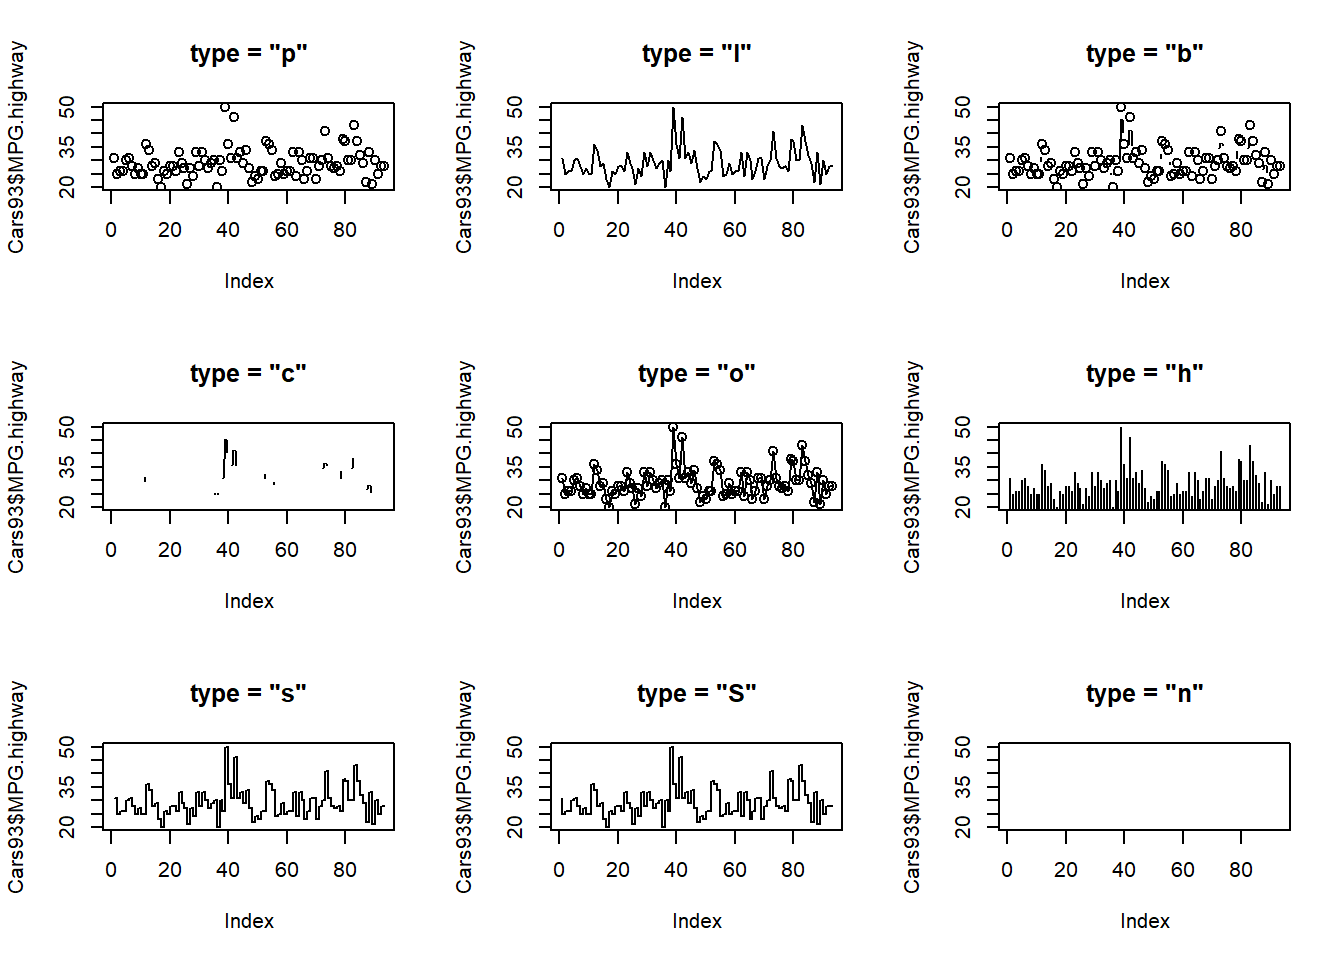
Figure 5.6: plot() 함수의 type 모수
par(mfrow = c())## named list()이 중에서 우리는 type = "p"와 type = "l"을 중심으로 살펴 보겠습니다.
5.2.1 기호 모양
그래픽 모수 pch는 다양한 모양의 기호 또는 상징을 선택할 수 있게 합니다. 디폴트는 pch = 1 로서 “속이 빈 원 모양”이며, 아래의 pch 그래픽 모수는 0부터 25까지의 식별 숫자로 원하는 모양을 선택할 수 있습니다.
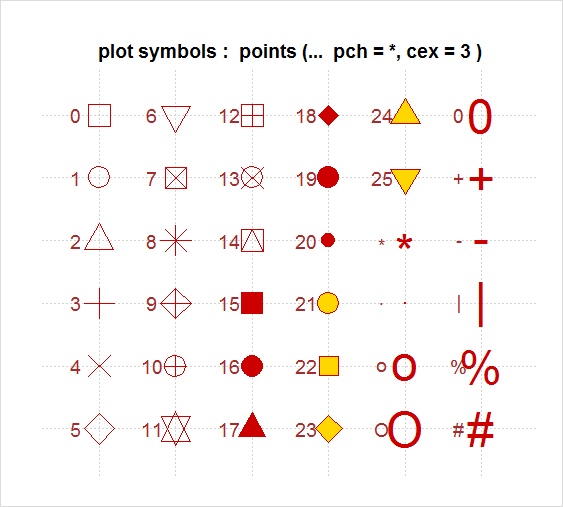
Figure 5.7: 기호 모양
MASS 패키지 내 Cars93 데이터프레임의 차 무게(Weight)와 고속도로연비(MPG.highway) 변수를 가지고 산포도 그래프를 아래와 같이 그려보았습니다. pch = 1 ~ pch = 6 까지 6개만 예로 들어보았습니다.
## 기호 모양 : pch =
library(MASS)

par(mfrow = c(3,2))

plot(MPG.highway ~ Weight, data = Cars93, pch = 1, main = "pch = 1")
plot(MPG.highway ~ Weight, data = Cars93, pch = 2, main = "pch = 2")
plot(MPG.highway ~ Weight, data = Cars93, pch = 3, main = "pch = 3")
plot(MPG.highway ~ Weight, data = Cars93, pch = 4, main = "pch = 4")
plot(MPG.highway ~ Weight, data = Cars93, pch = 5, main = "pch = 5")
plot(MPG.highway ~ Weight, data = Cars93, pch = 6, main = "pch = 6")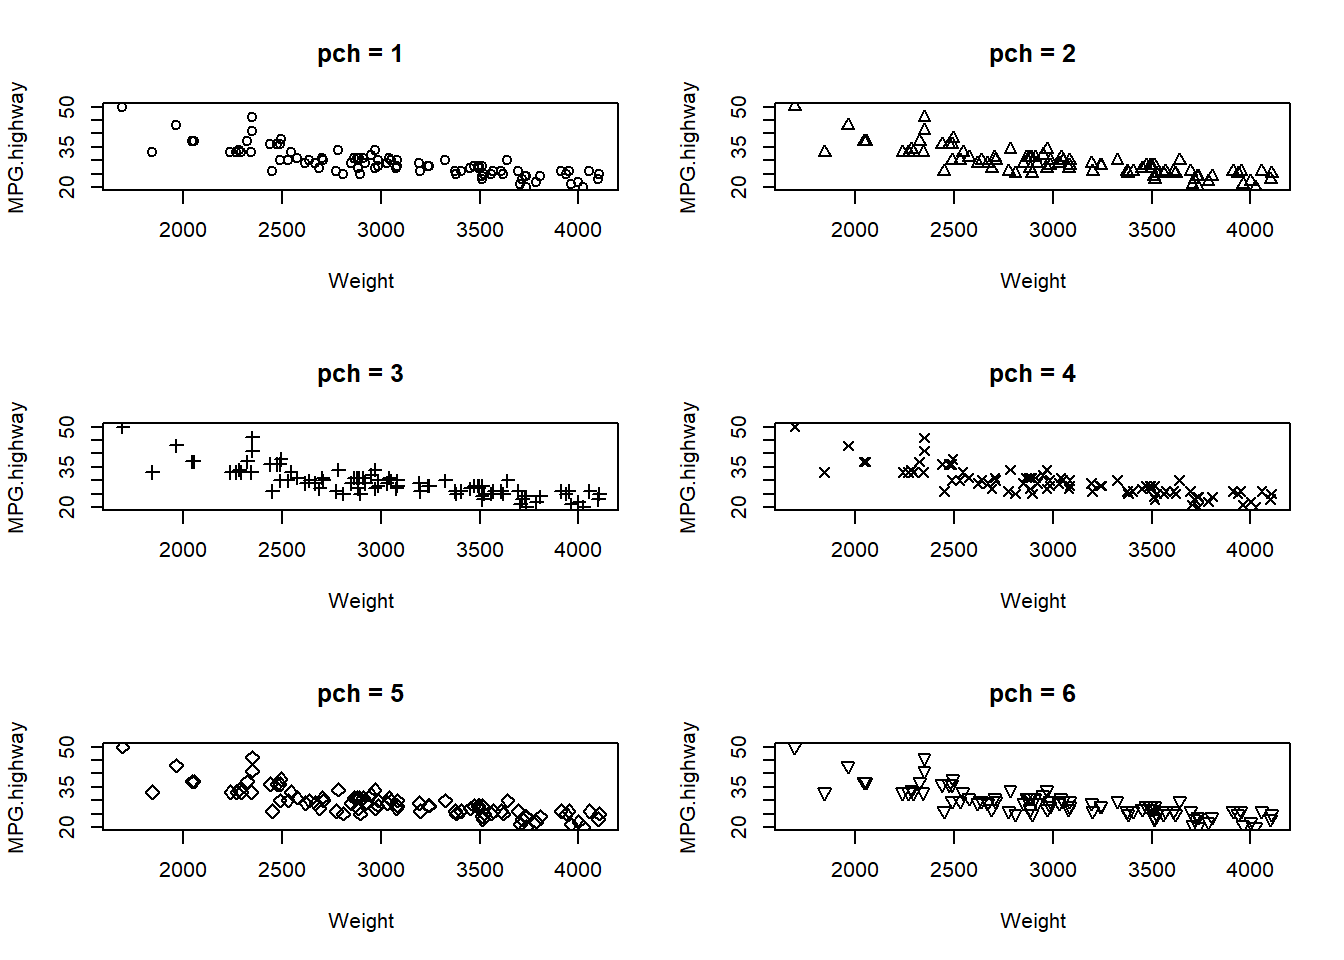
Figure 5.8: 그래프 모수의 설정 : 기호 모양 : pch
par(mfrow = c(1,1))5.2.2 기호 직접 입력
pch = 1 처럼 숫자를 입력하는 방법 말고도 pch = '$', pch = '%', pch = '*' 그리고 pch = 'ㅍ' 처럼 기호를 직접 입력할 수도 있습니다.
## specifying character directly
par(mfrow = c(2,2))

plot(MPG.highway ~ Weight, data = Cars93, pch = '$', main = "pch = '$' ")
plot(MPG.highway ~ Weight, data = Cars93, pch = '%', main = "pch = '%' ")
plot(MPG.highway ~ Weight, data = Cars93, pch = '*', main = "pch = '*' ")
plot(MPG.highway ~ Weight, data = Cars93, pch = 'ㅍ', main = "pch = 'ㅍ' ")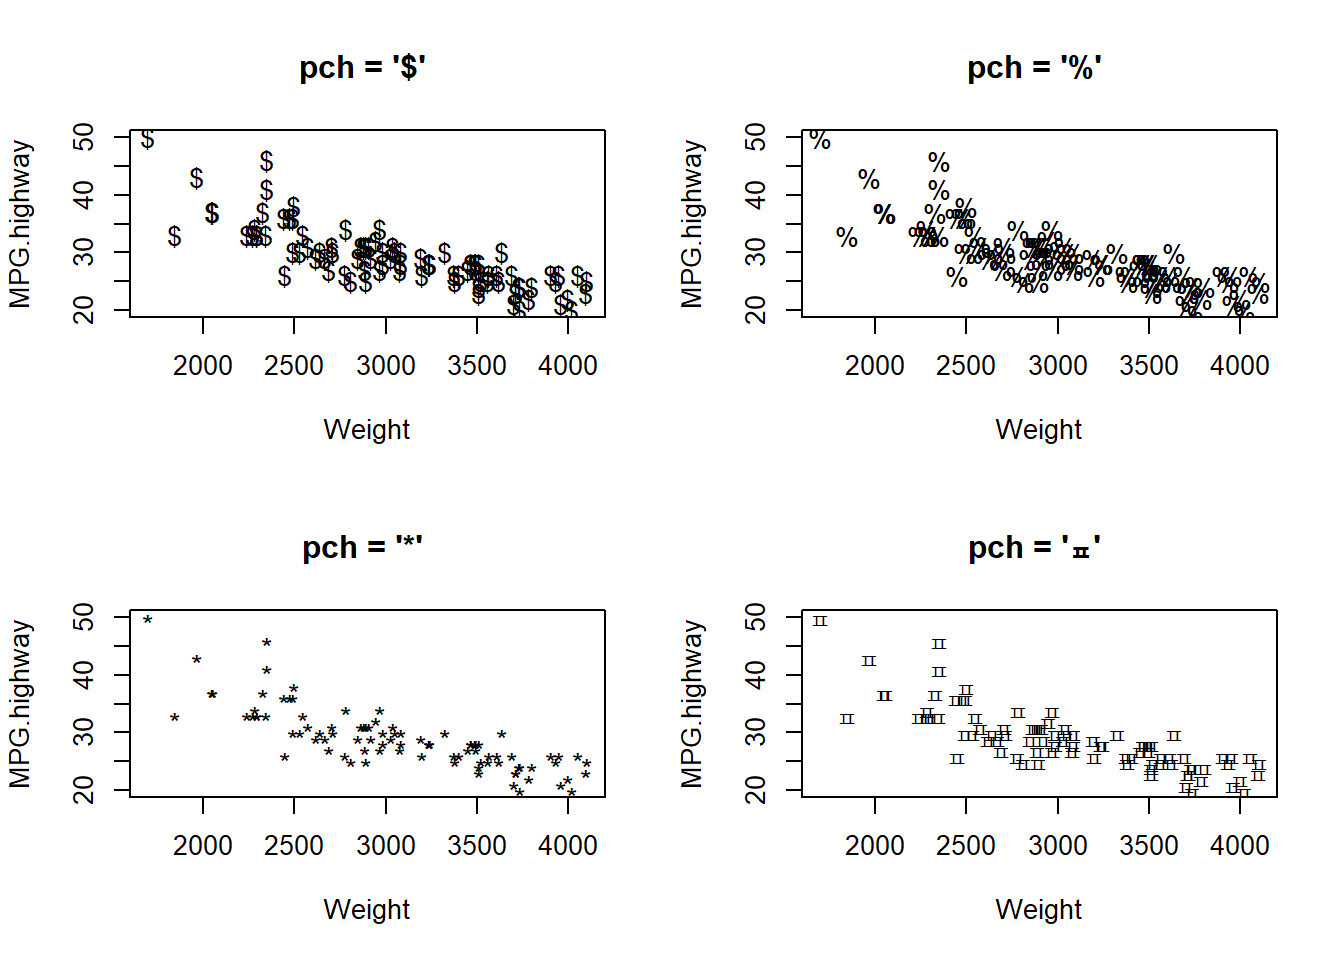
Figure 5.9: 그래프 모수의 설정 : 기호 모양 : 직접 지정
5.2.3 기호 크기
cex는 기호의 크기를 지정할 때 사용합니다. cex = 1 이 디폴트 크기이며, cex 다음에 입력하는 숫자는 디폴트 크기 대비 상대적인 크기를 나타냅니다.
## 기호 크기 : cex
par(mfrow = c(2, 3))
# plot display by 2 row and 3 column
plot(MPG.highway ~ Weight, data = Cars93, pch = 19, cex = 0.5, main = "cex = 0.5")
plot(MPG.highway ~ Weight, data = Cars93, pch = 19, cex = 1, main = "cex = 1 (default)")
plot(MPG.highway ~ Weight, data = Cars93, pch = 19, cex = 1.5, main = "cex = 1.5")
plot(MPG.highway ~ Weight, data = Cars93, pch = 19, cex = 2, main = "cex = 2")
plot(MPG.highway ~ Weight, data = Cars93, pch = 19, cex = 3, main = "cex = 3")
plot(MPG.highway ~ Weight, data = Cars93, pch = 19, cex = 4, main = "cex = 4")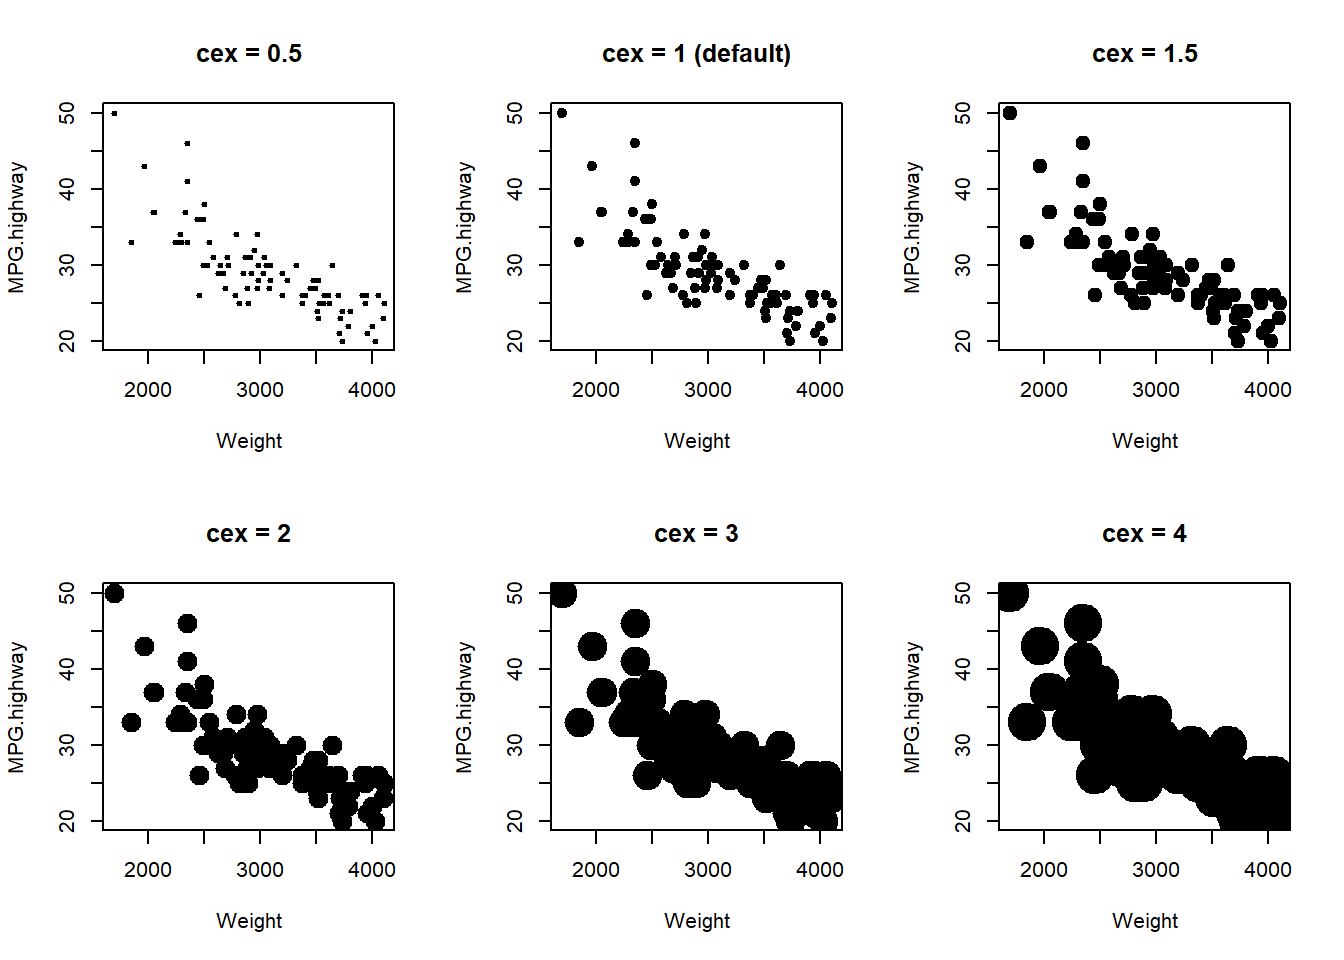
Figure 5.10: 그래프 모수의 설정 : 기호 크기 : cex