4.4 이변량 연속형 데이터 그래프
연속형 변수 2개를 그래프로 표시해 보겠습니다.
사용하는 변수는 Cars93$Weight 컬럼과 Cars93$MPG.highway 컬럼 등 2(이변량)개로, 이 두 변수 모두 int 형의 연속형 변수임을 알 수 있습니다.
이 절에서의 이변량 연속형 데이터에 대하여 다음의 그래프를 그려 보기로 한다.
4.4.1 산포도
산포도(scatter plot) 또는 산점도라고도 합니다. 산포도는 x축과 y축으로 이루어진 그래프에 두 변수의 값을 점으로 나타낸 그래프입니다.
산포도를 이용하면 두 변수의 관계를 파악하는데 용이합니다.
library(MASS)

##----- plot for 2 variables, continuous data
# scatter plot : plot(x, y)
with(Cars93,
     plot(Weight, MPG.highway, main = "scatter plot : plot(x, y)"))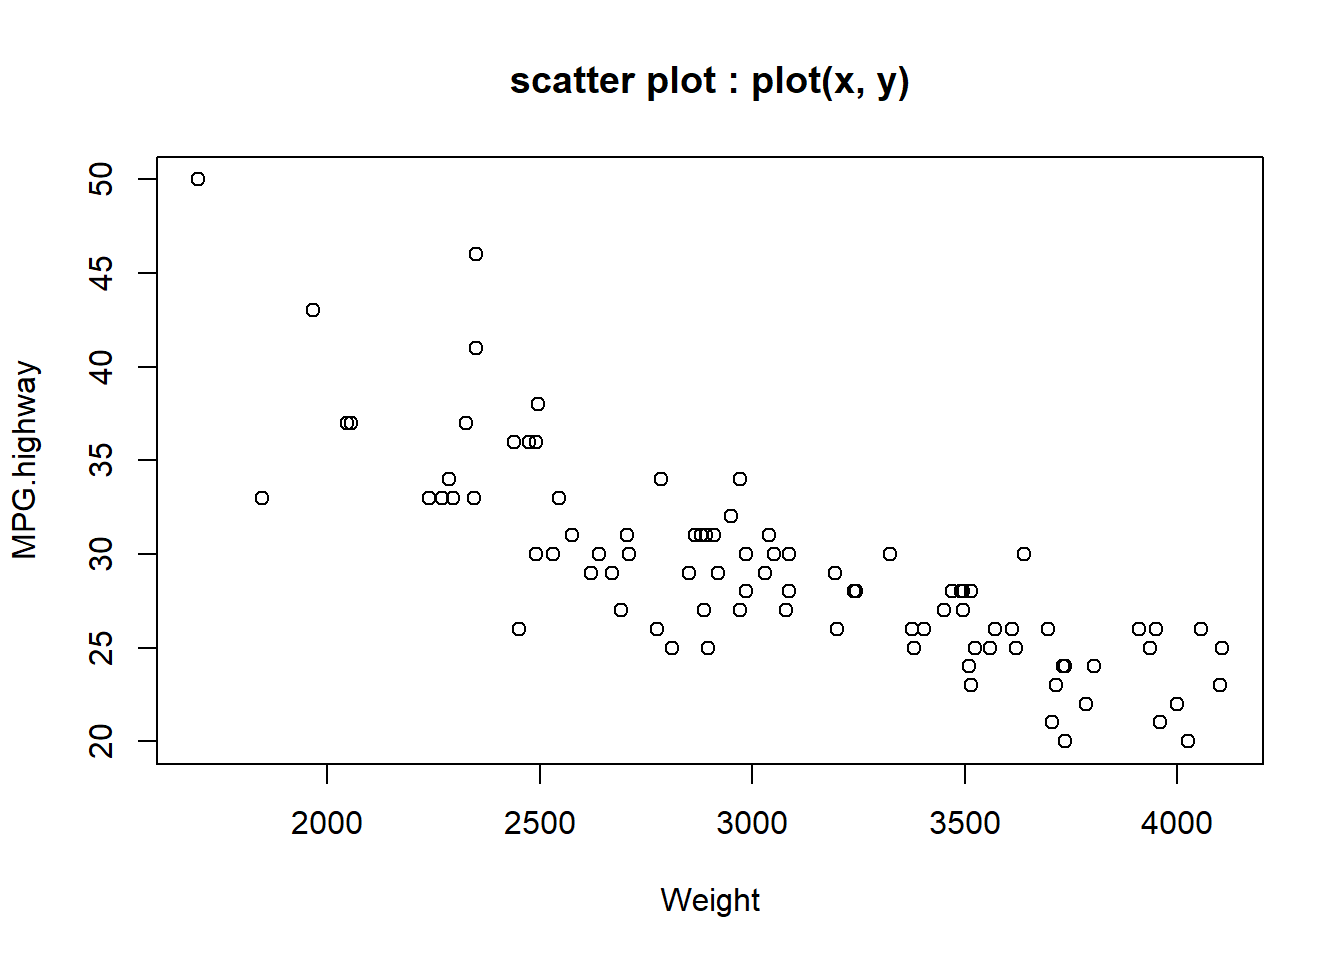
Figure 4.17: 이변량 연속형 데이터 그래프 : 산포도
[참고 : X-Y 플로팅]
4.4.2 산포도 행렬
산포도 행렬은 3개 이상의 변수들간의 관계를 행렬 형태의 그래프로 시각화하는 것입니다.
아래의 예는 Cars93 데이터 세트 중 4개의 변수 간의 산포도를 행렬 형태로 보여주고 있습니다.
Base Graphics 패키지의 plot() 함수와 car 패키지의 scatterplotMatrix() 함수의 사용을 예로 들어 보겠습니다.
먼저 Base Graphics 패키지의 plot() 함수를 이용한 4개 변수 간의 산포도 행렬을 작성하면 다음과 같습니다.
library(MASS)

# scatter plot matrix : plot(dataframe)
Cars93_subset <- Cars93[,c("Weight", "Horsepower", "MPG.highway", "MPG.city")]
plot(Cars93_subset, main = "scatter plot matrix : plot(dataframe)") 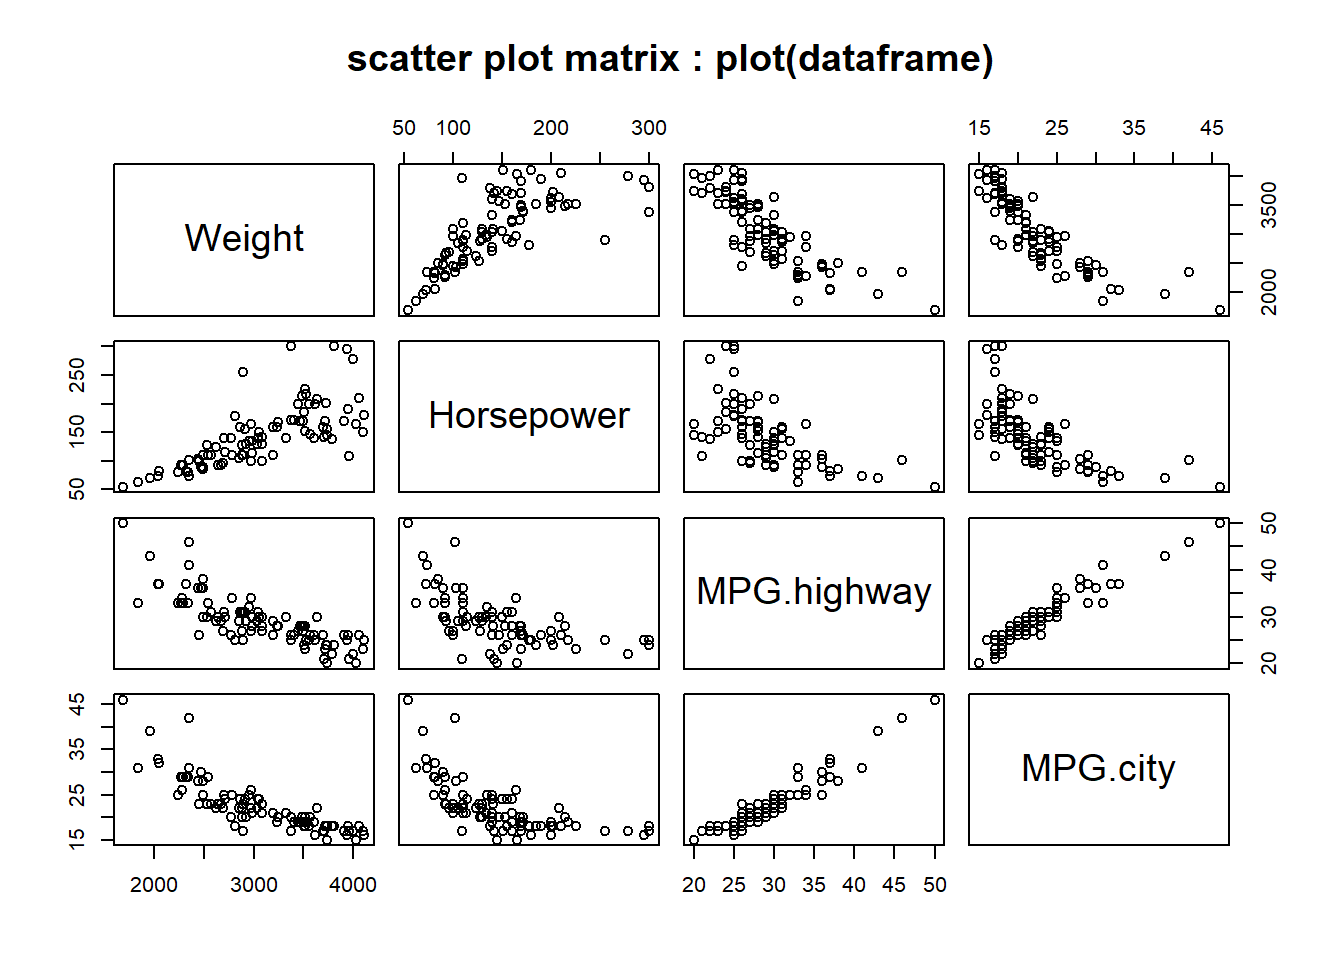
Figure 4.18: 다변량 연속형 데이터 그래프 : 산포도 행렬
또한 car 패키지의 scatterplotMatrix() 함수를 이용하면 다음과 같습니다.
# scatter plot matrix : scatterplotMatrix(dataframe)
# install.packages("car")
library(car)
## Loading required package: carDatascatterplotMatrix(Cars93_subset,
main = "scatter plot matrix : scatterplotMatrx(dataframe)")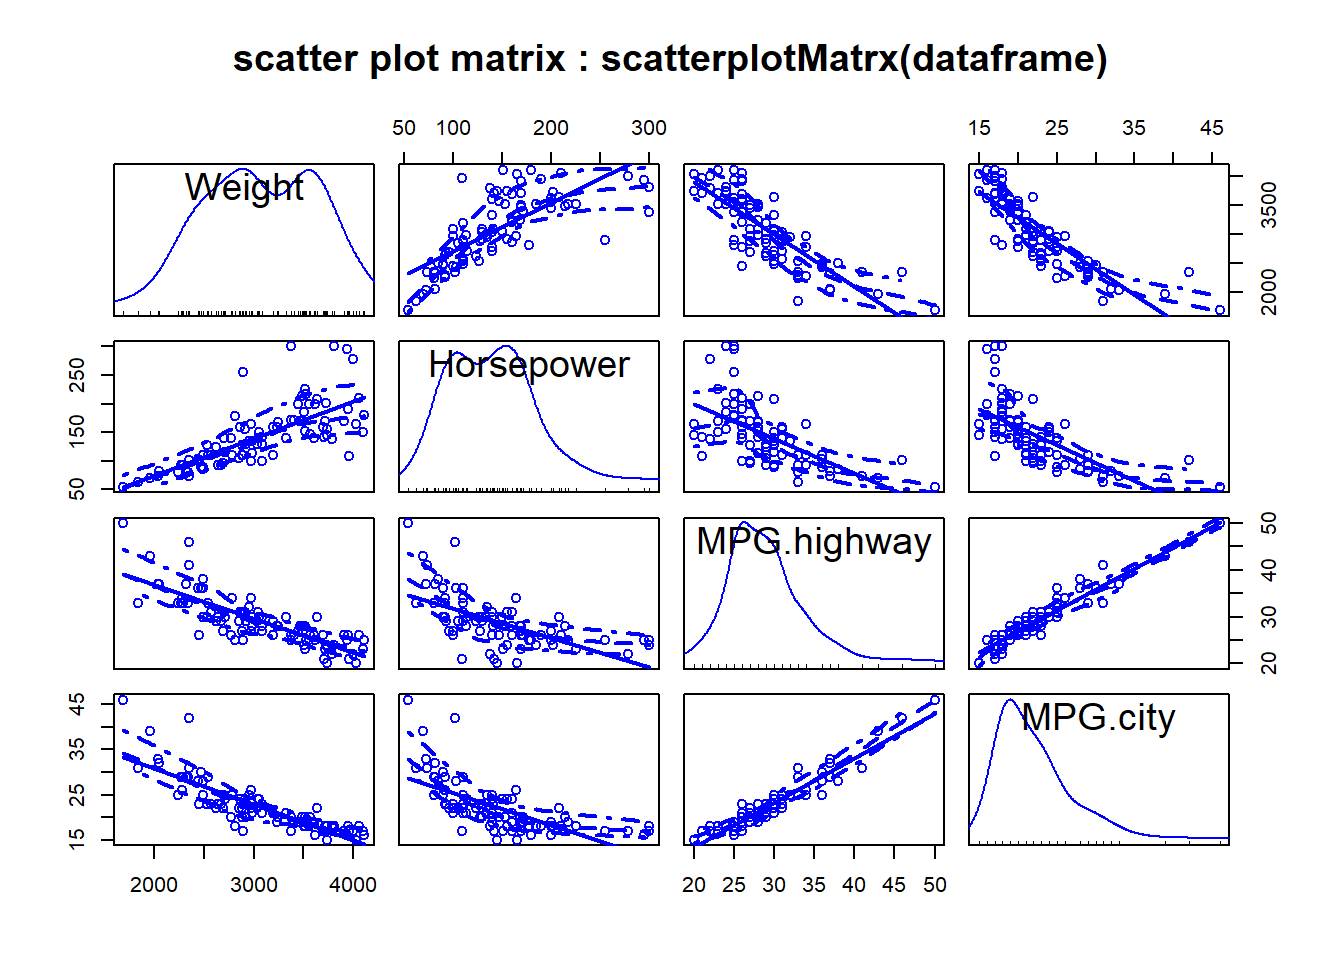
Figure 4.19: 다변량 연속형 데이터 그래프 : 산포도 행렬
자세한 사항은 ? scatterplotMatrix로 확인할 수 있습니다.
4.4.2.1 그래프 위의 데이터 모양 변경
그런데 plot() 함수는 기본적으로 데이터를 점(type = "p")으로 표현합니다. 다음 장에서 이들 모수에 대하여 자세히 살펴 볼 것입니다. 여기서는 여러 모수 중에서 type = 모수 부분를 변경하면서 그래프로 시각화해 보면 다음과 같습니다.
library(MASS)

##--------
# plot by various type : l, h, b, o, s, n
# order by Weight
Cars93_1 <- Cars93[order(Cars93$Weight),]

# dividing window frame

# plots by type
attach(Cars93_1)
## The following object is masked _by_ .GlobalEnv:
##
## Cylinderstypes <- c("p", "l", "b", "c", "o", "h", "s", "S", "n") # 다양한 type 옵션들
titles <- c("type = 'p'", "type = 'l'", "type = 'b'", "type = 'c'", "type = 'o'",
"type = 'h'", "type = 's'", "type = 'S'", "type = 'n' : Empty Graph")
plot(MPG.highway ~ Weight, main = "Default Type") # type을 지정하지 않은 경우의 기본 모양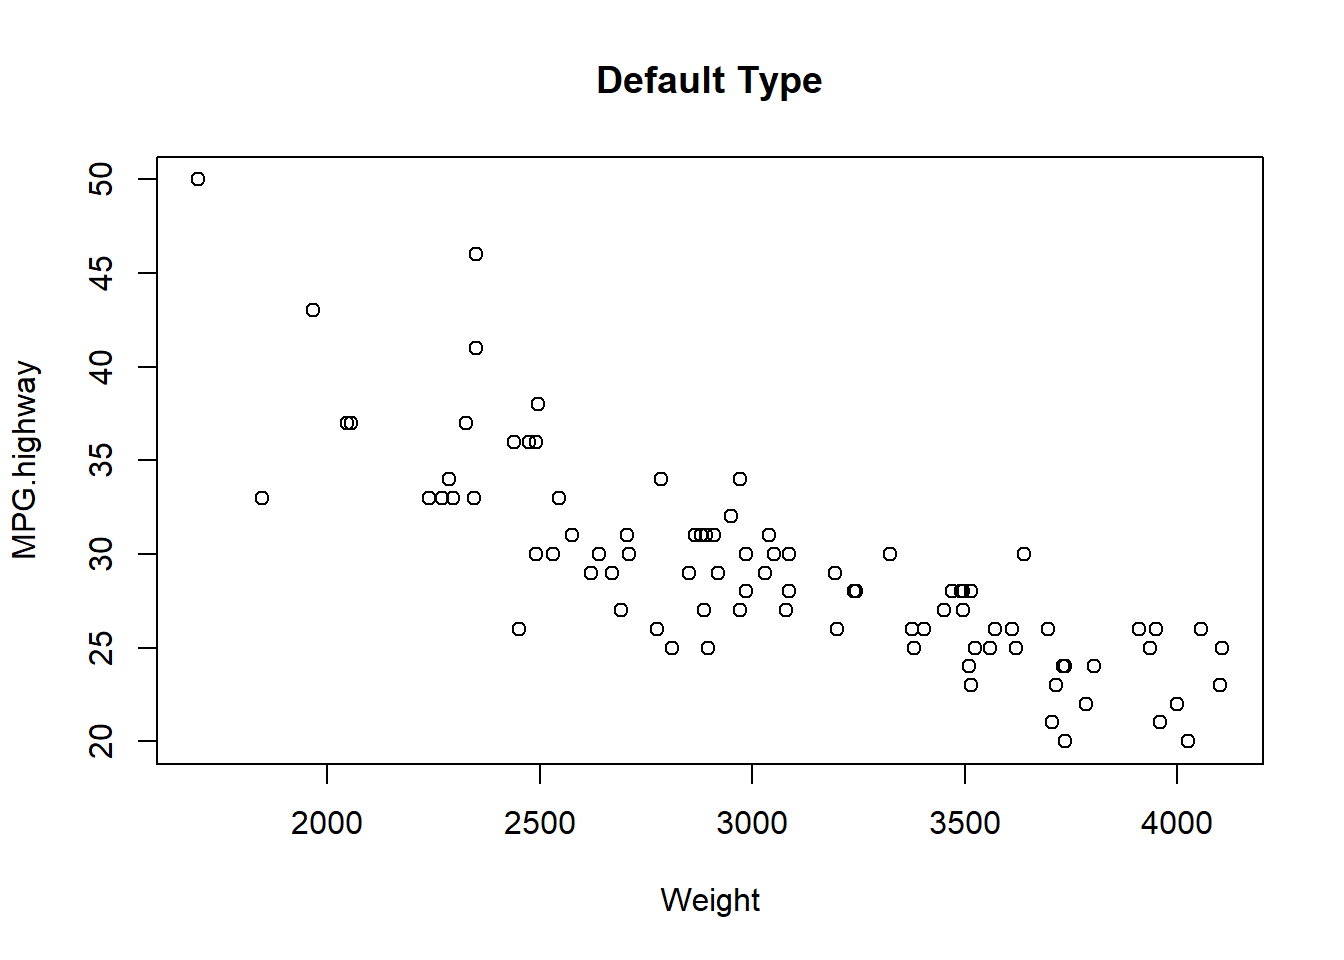
Figure 4.20: 이변량 연속형 데이터 그래프 : 산포도 - 모양 변경
par(mfrow = c(3, 3))
for (i in 1:9) {
  plot(MPG.highway ~ Weight, type = types[i], main = titles[i])
}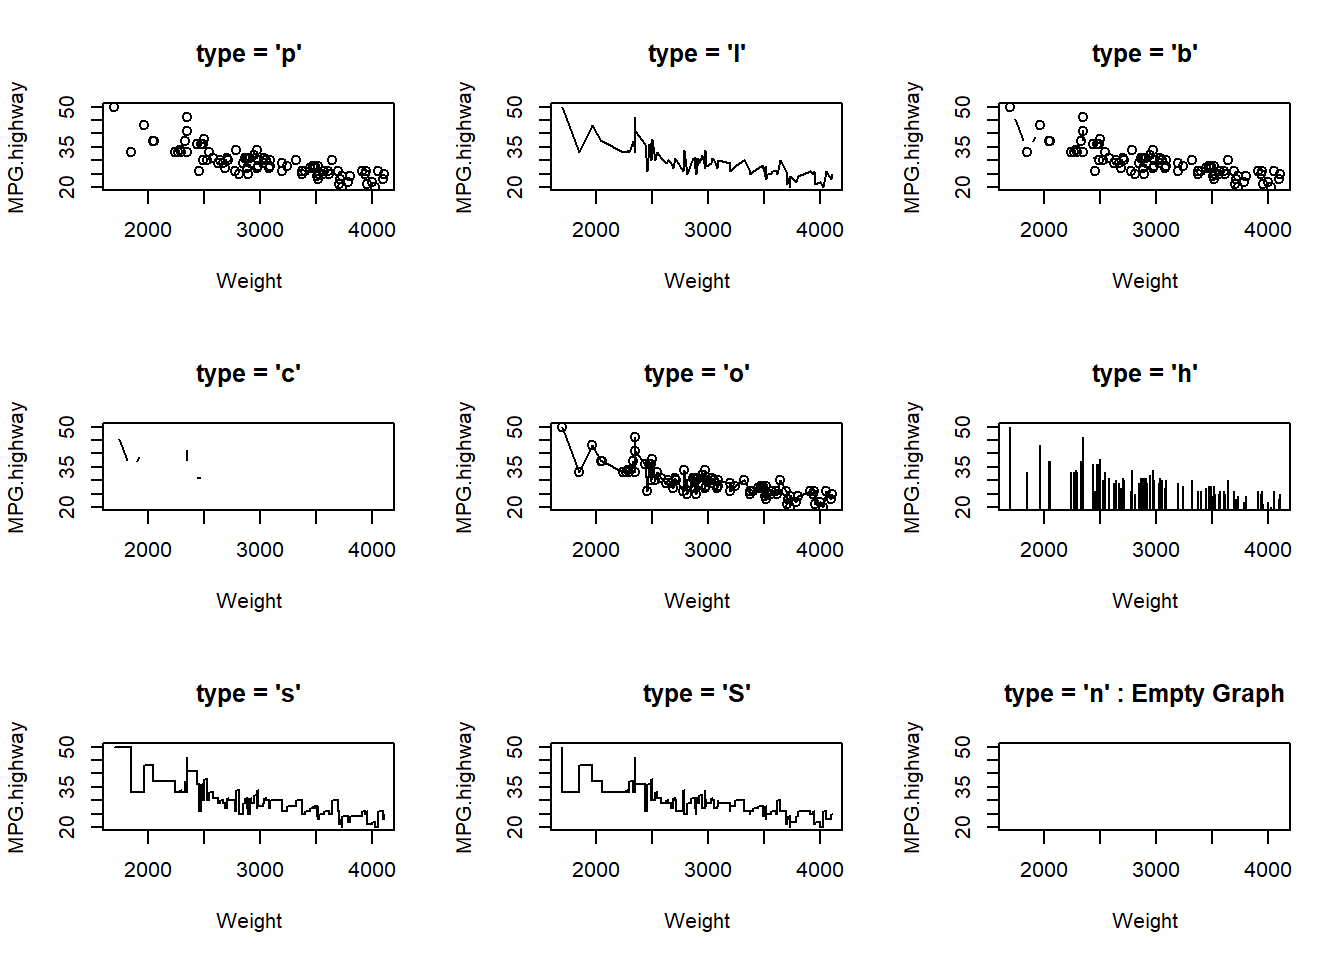
Figure 4.21: 이변량 연속형 데이터 그래프 : 산포도 - 모양 변경
detach(Cars93_1)
par(mfrow = c(1, 1))
이러한 높은 수준의 그래프 함수를 이용하여 바탕이 되는 그래프를 시각화해 줍니다. 그리고 높은 수준의 그래프 함수들은 공통의 모수와 고유한 모수를 이용하여 표현 형식을 설정할 수 있습니다. 또한 낮은 수준의 그래프 함수를 이용하여 그래프 위에 좀 더 다양한 정보를 표시할 수 있습니다.