5.4 색 지정
지난 절에서는 R 그래프 모수(Graphical Parameters)를 설정하는 2가지 방법, 그리고 기호 모양과 크기, 선의 유형(Line Type, lty)과 선의 두께(Line Width, lwd) 등의 옵션에 대해서 알아보았습니다.
이번 절서는 그래프 모수 중에서 색(color)을 설정하는 방법에 대해서 알아보겠습니다.
| 모수 | 기능 설명 |
|---|---|
| col | 기호, 선, 문자 등의 색깔을 디폴트로 지정 |
| col.axis | 축의 색 지정 |
| col.lab | x축과 y축의 레이블 색 지정 |
| col.main | 제목 색 지정 |
| col.sub | 부제목의 색 지정 |
| fg | 그래프 전경 색 지정 |
| bg | 그래프 배경 색 지정 |
아마도 대부분은 col 모수를 주로 사용하고 나머지 색상 관련 모수는 거의 사용하지 않을 듯 합니다만, R에서는 사용자가 원하면 거의 모든 부분의 색상을 원하는대로 설정할 수 있는 극강의 자유도를 제공합니다.
R이 그래픽의 절대강자인 이유가 이처럼 다양한 모수를 제공해주는데 있습니다. 초보자라면 그냥 디폴트 옵션 사용하시면 되구요, 그래프에 욕심이 있는 분이라면 R의 색상 모수에 대해서 차근차근 공부해두시면 유용할 것입니다.
하나씩 차례대로 살펴보도록 하겠습니다.
5.4.1 기호, 선, 문자 등의 디폴트 색 지정
R에서 지원하는 색의 종류에는 657개가 있습니다. colors() 함수를 사용하면 657개 전체 색 리스트를 볼 수 있습니다.
##-------------------------------
## Graphical parameters : color
##-------------------------------
length(colors())
## [1] 657colors()위처럼 text로 색깔 이름만 있으면 알기 어려울 수도 있는데요, Earl F. Glynn 가 657개 색을 각 숫자별로 그리드에 색을 보기에 좋도록 정리를 해놓았습니다.
[ Color Chart by Earl F. Glynn, Stowers Institute for Medical Research, 24 May 2005 ]
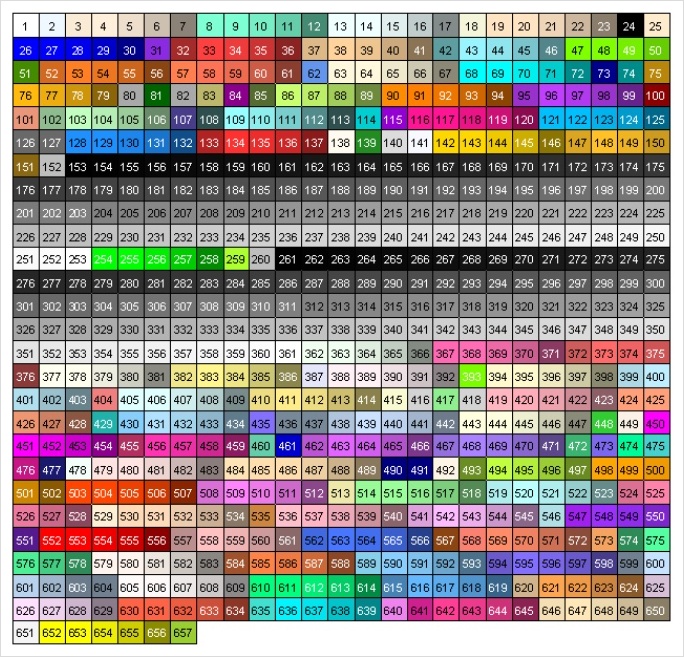
Figure 5.14: Earl F. Glynn의 색상 표
* 출처 : http://research.stowers-institute.org/efg/R/Color/Chart/index.htm
R에서 색을 지정하는 방법에는 (1) 색 식별 숫자 (index), (2) 색 이름 (color name), (3) 16진수 (hexadecimal), (4) RGB 색상표 등을 이용하는 4가지 방법이 있습니다.
| 식별 숫자 | 색 이름 | 16진수 | RGB Triple |
|---|---|---|---|
| 4 | (26번) blue | #0000FF | 0 0 255 |
| NA | (62번) comflowerblue | #6495ED | 100 149 237 |
| NA | (73번) darkblue | #00008B | 0 0 139 |
5.4.1.1 식별 숫자의 이용
먼저 (1) 숫자(index)로 지정하는 방법은 편하긴 한데요, 선택할 수 있는 색은 아래와 같이 8가지가 있어서 매우 제한적입니다.
| 식별 숫자 | 색 |
|---|---|
| 0 | 흰색 (white) |
| 1 | 검정색 (black) |
| 2 | 빨강색 (red) |
| 3 | 초록색 (green) |
| 4 | 파랑색 (blue) |
| 5 | 청록색 (turquoise) |
| 6 | 자홍색 (magenta) |
| 7 | 노란색 (yellow) |
| 8 | 회색 (gray) |
다음의 예는 원을 8 등분 또는 16 등분하여 각 조각의 색을 지정하기 위해 col = 모수를 사용하고, 조각의 색을 식별 숫자로 지정하는 파이 차트의 예를 보여 주고 있습니다.
# color by index 1~8
par(mfrow=c(1,2))
pie(rep(1, 8), col = 1:8)         # 1 ~ 8 번까지 지정합니다.
pie(rep(1, 16), col = 1:16)       # 9 ~ 16 번까지의 색은 1 ~ 8 번의 색으로 지정됩니다.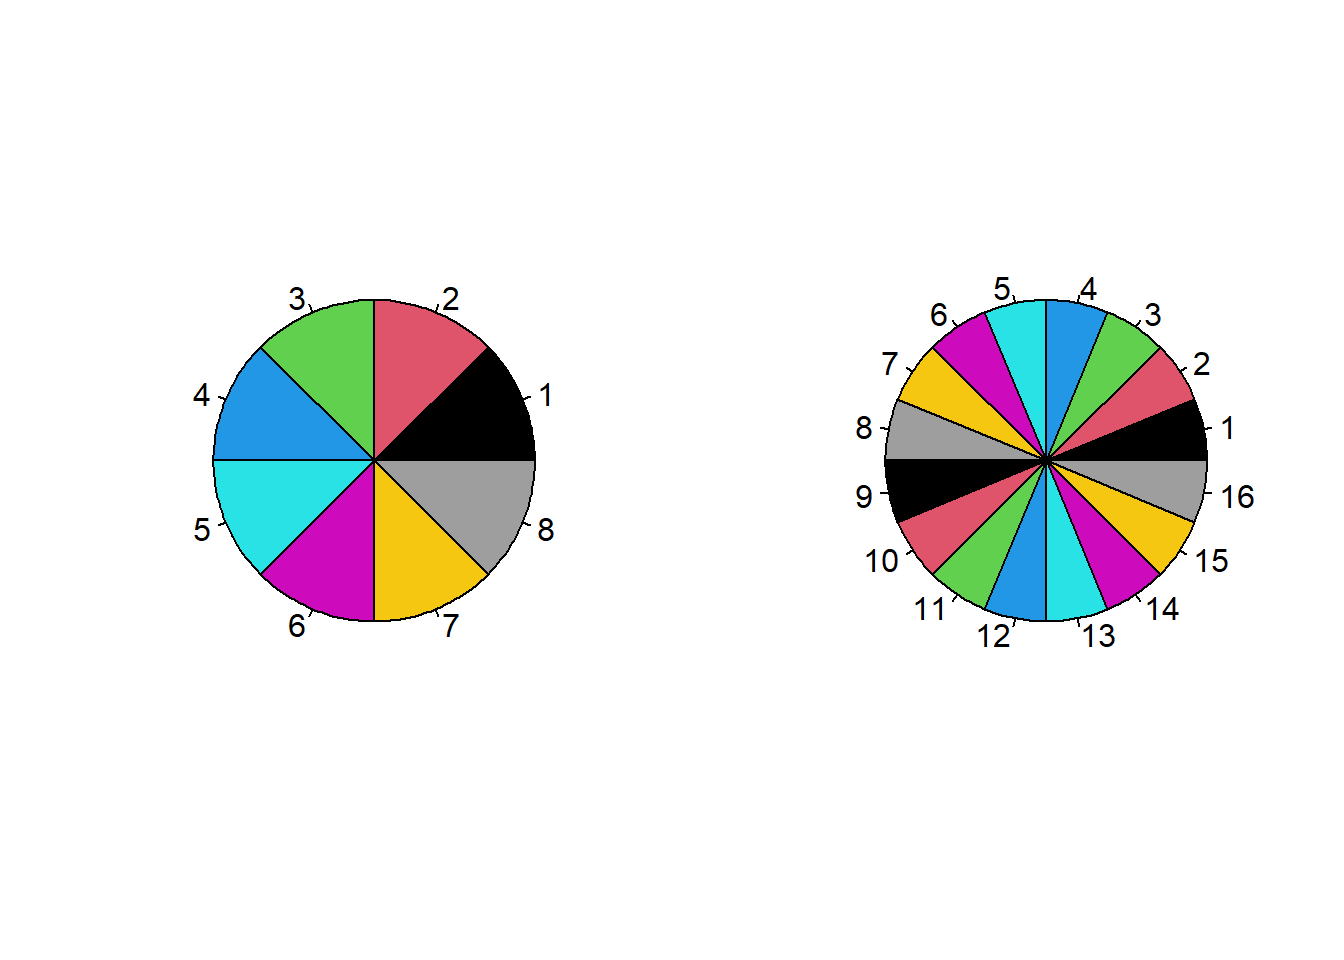
Figure 5.15: 색 지정 : 색 식별 번호
5.4.1.2 색 이름, 16진법, RGB 색상표 이용
반면, (2) 이름(color name), (3) 16진법 표기 (hexadecimal), (4) RGB 색상표 (RGB triple) 은 매우 다양한 색상을 선택할 수 있는 장점이 있습니다. 아래는 Earl F. Glynn가 작성한 색상표에서 일부를 화면캡쳐한 내용인데요, 모든 색상표는 아래의 출처에 있는 pdf url에 있습니다.
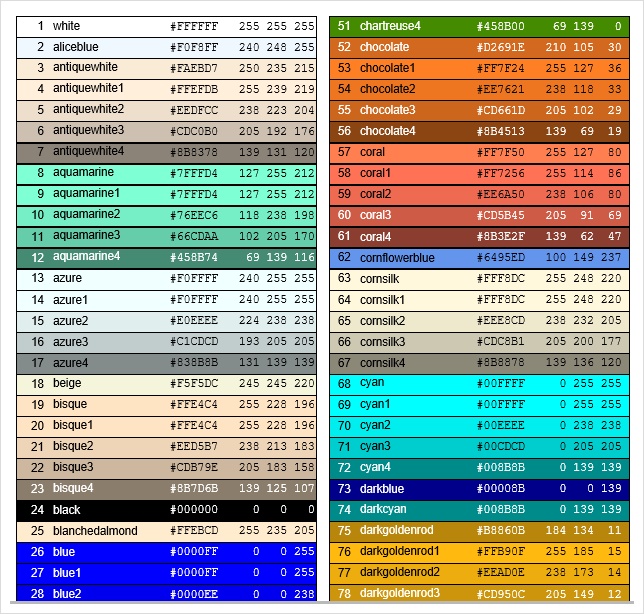
Figure 5.16: Earl F. Glynn가 작성한 색상표
* 참고자료 : https://rstudio-pubs-static.s3.amazonaws.com/3486_79191ad32cf74955b4502b8530aad627.html
파란색(blue)에 대해서 위의 4가지 방법, 즉 (1) 숫자 (index), (2) 색 이름 (color name), (3) 16진수 (hexadecimal), (4) RGB 색상표를 사용해서 R 함수 예를 들어보겠습니다. 파란색(blue)으로 모두 똑같은 결과가 나았습니다.
library(MASS)

## '파란색' 설정 예
par(mfrow = c(2,2))

# method 1 : 색인번호
plot(MPG.highway ~ Weight, Cars93, cex = 2, pch = 19,
     col = 4, main = "col = 4 (index)")

# method 2 : 색 이름
plot(MPG.highway ~ Weight, Cars93, cex = 2, pch = 19,
     col = "blue", main = "col = blue (name)")

# method 3 : 16진수 코드
plot(MPG.highway ~ Weight, Cars93, cex = 2, pch = 19,
     col = "#0000FF", main = "col = #0000FF (hexadecimal)")

# method 4 : 3자리로 이루어진 RGB 코드
rgb_1 <- rgb(0, 0, 255, maxColorValue=255)
plot(MPG.highway ~ Weight, Cars93, cex = 2, pch = 19,
     col = rgb_1, main = "col = RGB(0, 0, 255)(RGB triple)")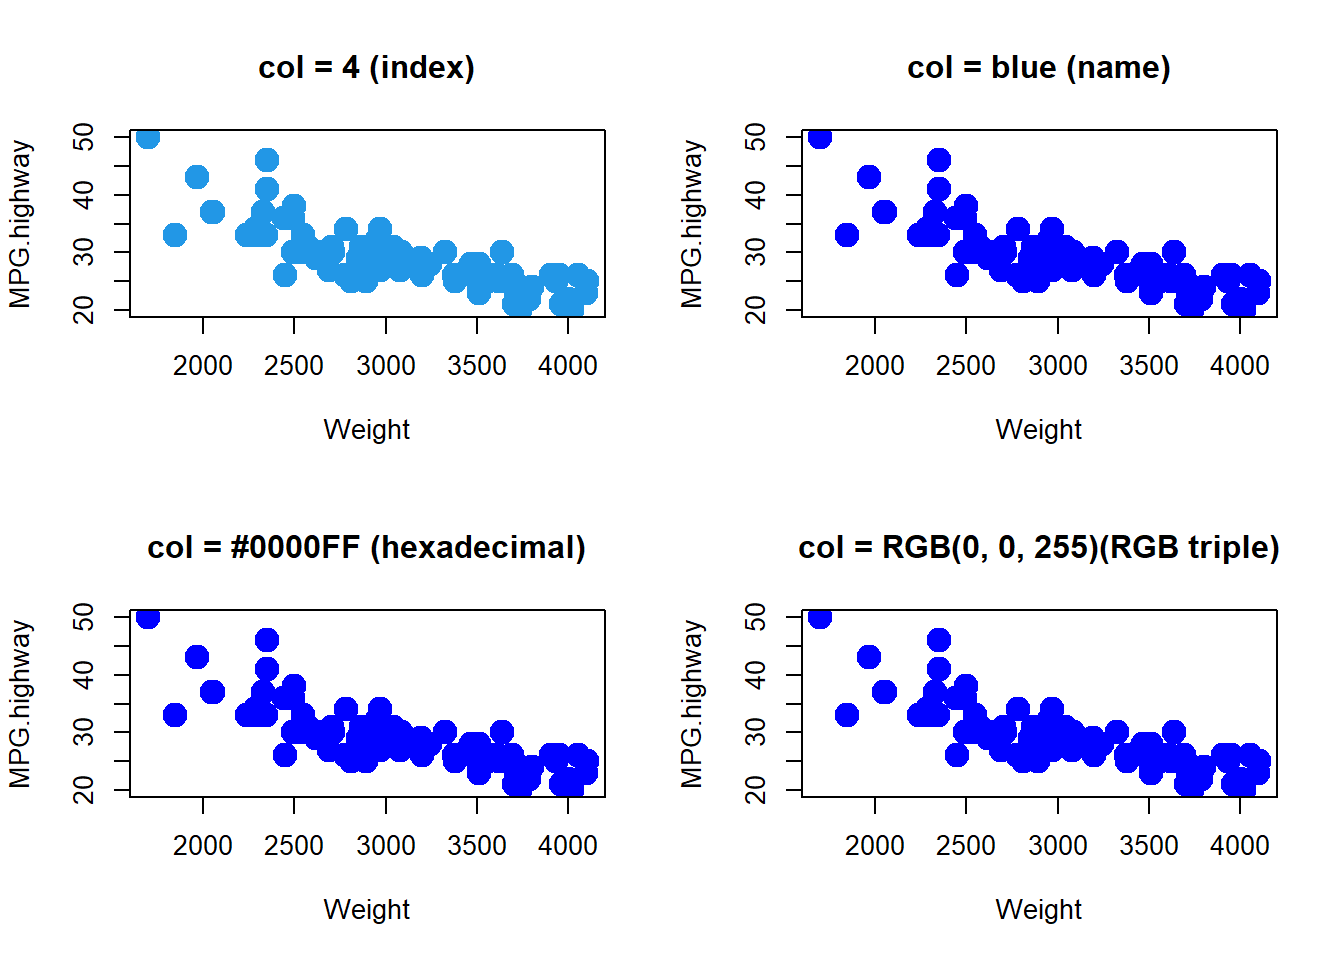
Figure 5.17: 색 지정 : 색 이름
5.4.1.3 팔레트 색상
R에서는 색상 관련해서 서로 보완(complementing)되거나 대조를 이루는(contrasting) 색상들을 미리 파레트 형식으로 정의(defined palettes of colors)해 놓은 것이 있습니다.
rainbow(n),heat.colors(n),terrain.colors(n),topo.colors(n),cm.colors(n)
등이 있습니다.
example(rainbow) 함수를 이용해서 이들 색상표 palettes 를 살펴 볼 수 있습니다. 계속 Enter 치면 다음 화면으로 넘어갑니다.
[ 색상 파레트 (defined palattes of colors) ]
## example of rainbow palette's colors
example(rainbow)5.4.2 축의 척도 색 지정
x축과 y축의 척도 표기 색상을 지정할 때 col.axis 모수 옵션을 사용합니다. 아래에 x축과 y축 척도 표기 색상으로 파랑색, 빨강색, 노랑색, 회색으로 바꿔가면서 그래프를 그려보았습니다.
## 축의 척도 색 지정 : col.axis

par(mfrow = c(2,2))
plot(MPG.highway ~ Weight, Cars93, cex = 1, pch = 21,
     col.axis = "blue", main = "col.axis = blue")

plot(MPG.highway ~ Weight, Cars93, cex = 1, pch = 21,
     col.axis = "red", main = "col.axis = red")

plot(MPG.highway ~ Weight, Cars93, cex = 1, pch = 21,
     col.axis = "yellow", main = "col.axis = yellow")

plot(MPG.highway ~ Weight, Cars93, cex = 1, pch = 21,
     col.axis = "gray", main = "col.axis = gray")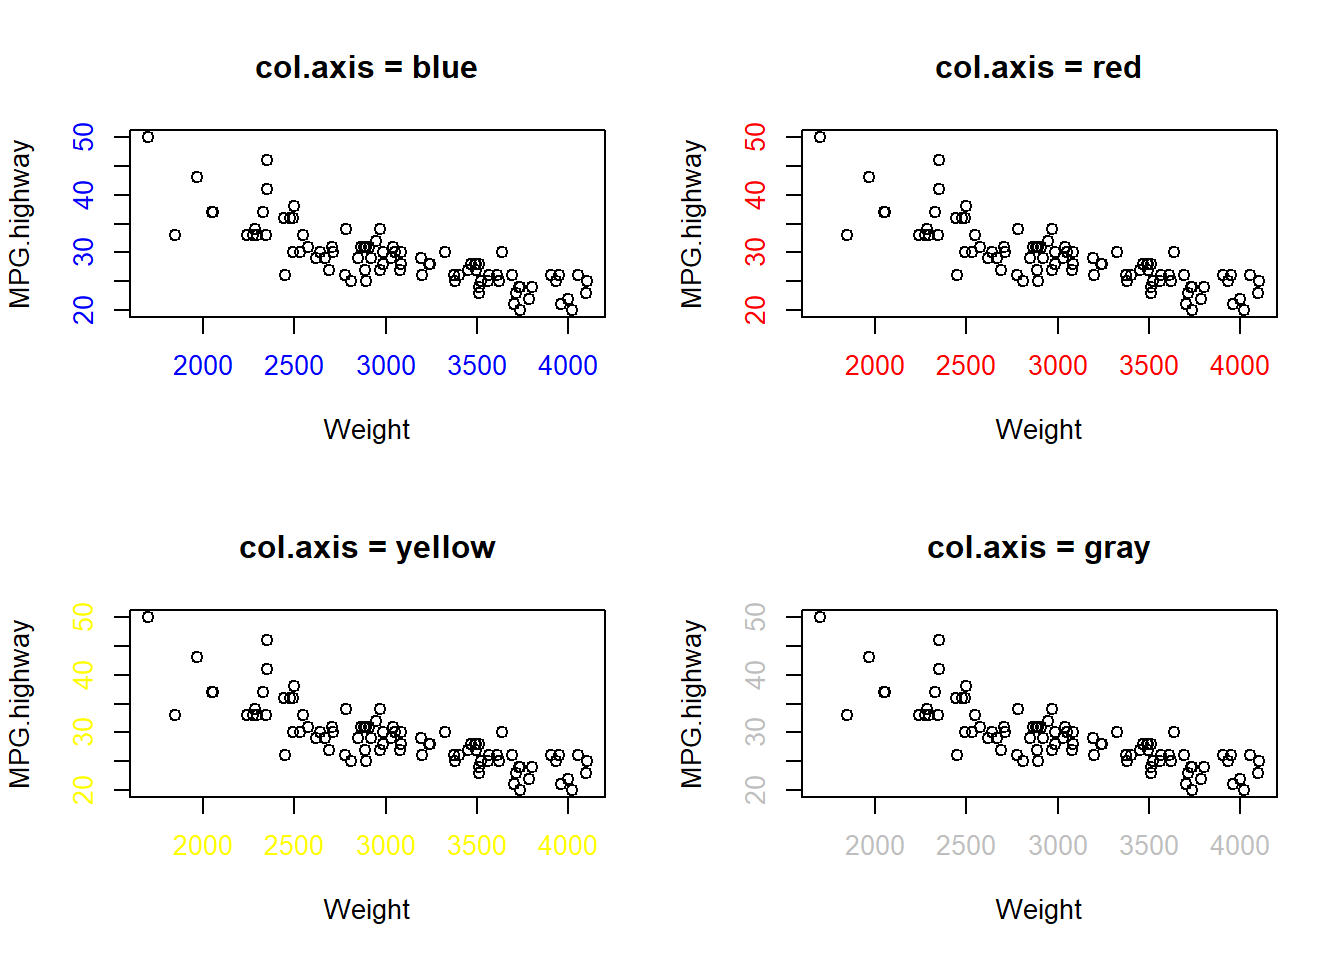
Figure 5.18: 색 지정 : 축의 척도 색
5.4.3 x축과 y축의 제목 색 지정
이번에는 x축과 y의 Lable 색을 지정하는 방법으로 col.lab 모수 옵션을 사용하면 됩니다. 파랑색, 빨강색, 노랑색, 회색으로 x축과 y축의 Lable 색을 설정하는 예를 들어보겠습니다.
## x축과 y축의 제목 색 : col.lab

par(mfrow = c(2,2))
plot(MPG.highway ~ Weight, Cars93, cex = 1, pch = 21,
     col.lab = "blue", main = "col.lab = blue")

plot(MPG.highway ~ Weight, Cars93, cex = 1, pch = 21,
     col.lab = "red", main = "col.lab = red")

plot(MPG.highway ~ Weight, Cars93, cex = 1, pch = 21,
     col.lab = "yellow", main = "col.lab = yellow")

plot(MPG.highway ~ Weight, Cars93, cex = 1, pch = 21,
     col.lab = "gray", main = "col.lab = gray")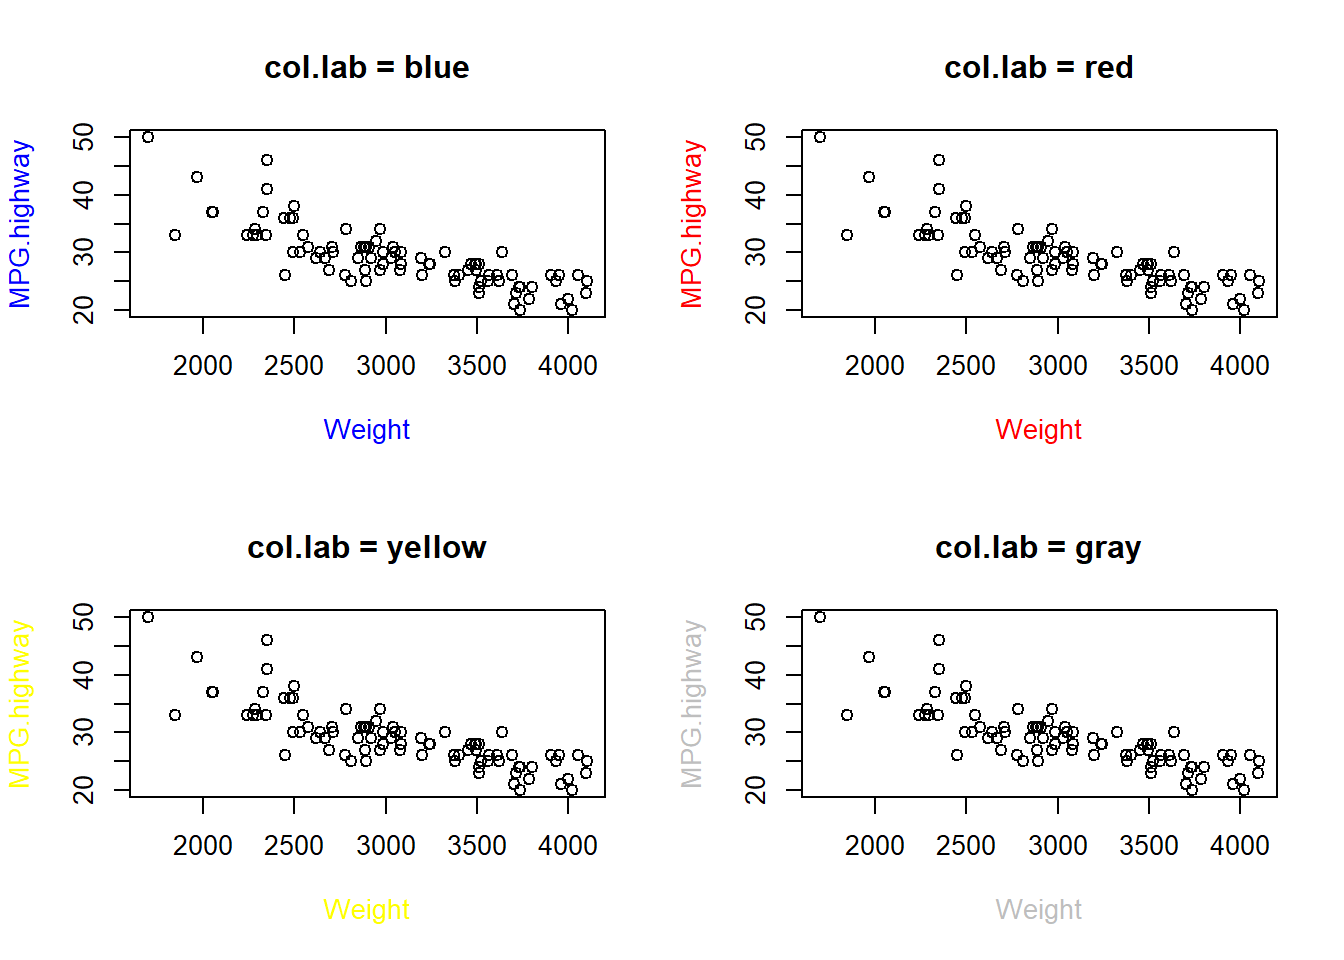
Figure 5.19: 색 지정 : x축과 y축의 제목 색
5.4.4 제목 색 지정
## 제목 색 지정 : col.main
par(mfrow = c(2, 2))

plot(MPG.highway ~ Weight, Cars93, cex = 1, pch = 21,
     col.main = "blue", main = "col.main = blue")

plot(MPG.highway ~ Weight, Cars93, cex = 1, pch = 21,
     col.main = "red", main = "col.main = red")

plot(MPG.highway ~ Weight, Cars93, cex = 1, pch = 21,
     col.main = "yellow", main = "col.main = yellow")

plot(MPG.highway ~ Weight, Cars93, cex = 1, pch = 21,
     col.main = "gray", main = "col.main = gray")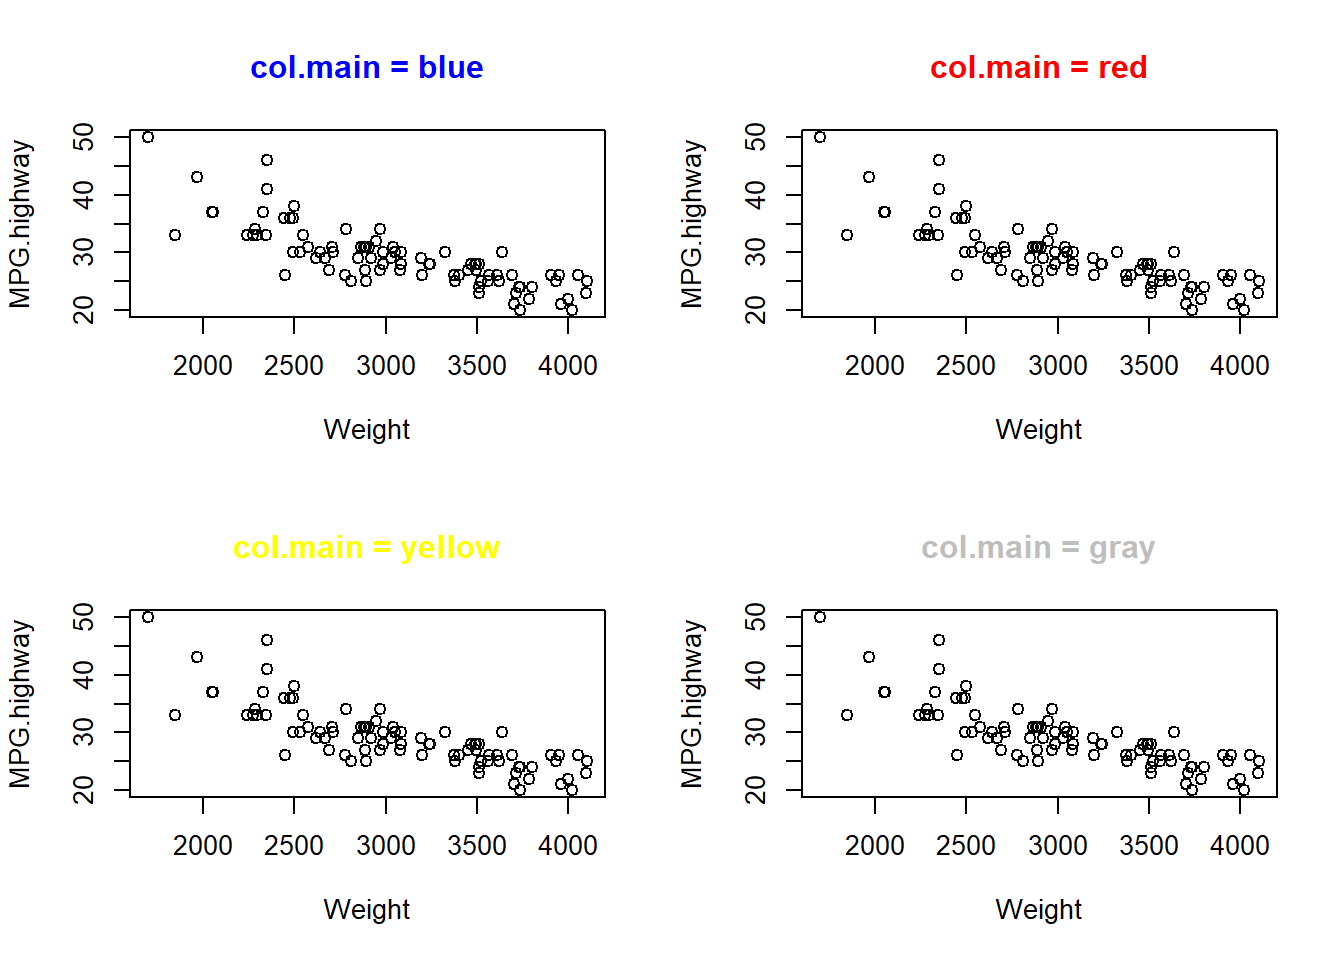
Figure 5.20: 색 지정 : 제목
5.4.5 부제목 색 지정
## 부제목 색 지정 : col.sub
par(mfrow = c(2, 2))

plot(MPG.highway ~ Weight, Cars93, cex = 1, pch = 21,
     col.sub = "blue", sub = "col.sub = blue")

plot(MPG.highway ~ Weight, Cars93, cex = 1, pch = 21,
     col.sub = "red", sub = "col.sub = red")

plot(MPG.highway ~ Weight, Cars93, cex = 1, pch = 21,
     col.sub = "yellow", sub = "col.sub = yellow")

plot(MPG.highway ~ Weight, Cars93, cex = 1, pch = 21,
     col.sub = "gray", sub = "col.sub = gray")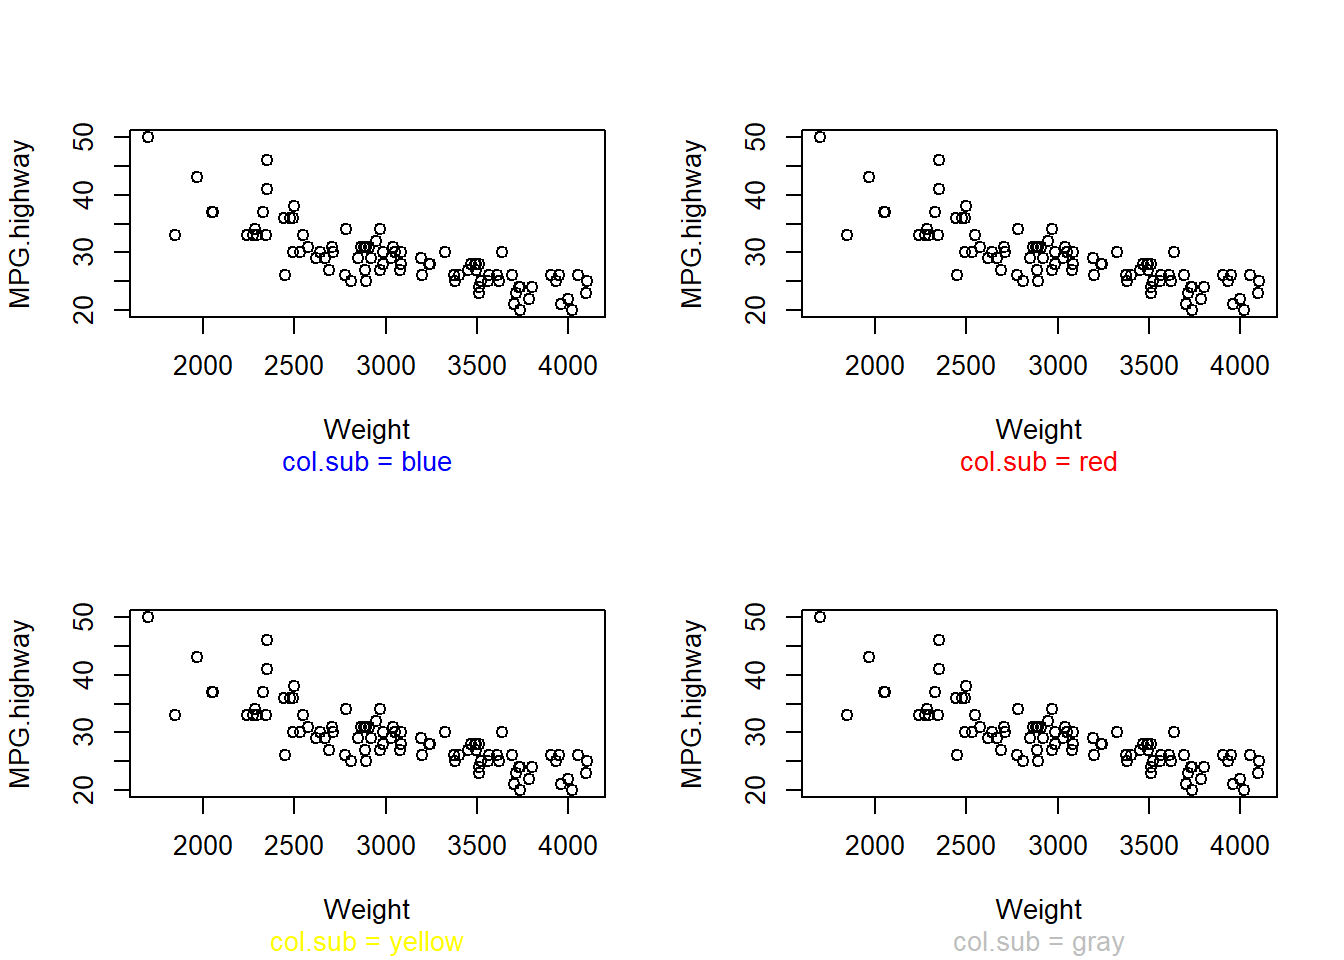
Figure 5.21: 색 지정 : 부제목 색
5.4.6 그래프 전경 색 지정
## 그래프 전경 색 지정 : fg
par(mfrow = c(2, 2))

plot(MPG.highway ~ Weight, Cars93, cex = 1, pch = 21,
     fg = "blue", main = "fg (foreground) = blue")

plot(MPG.highway ~ Weight, Cars93, cex = 1, pch = 21,
     fg = "red", main = "fg (foreground) = red")

plot(MPG.highway ~ Weight, Cars93, cex = 1, pch = 21,
     fg = "yellow", main = "fg (foreground) = yellow")

plot(MPG.highway ~ Weight, Cars93, cex = 1, pch = 21,
     fg = "gray", main = "fg(foreground) = gray")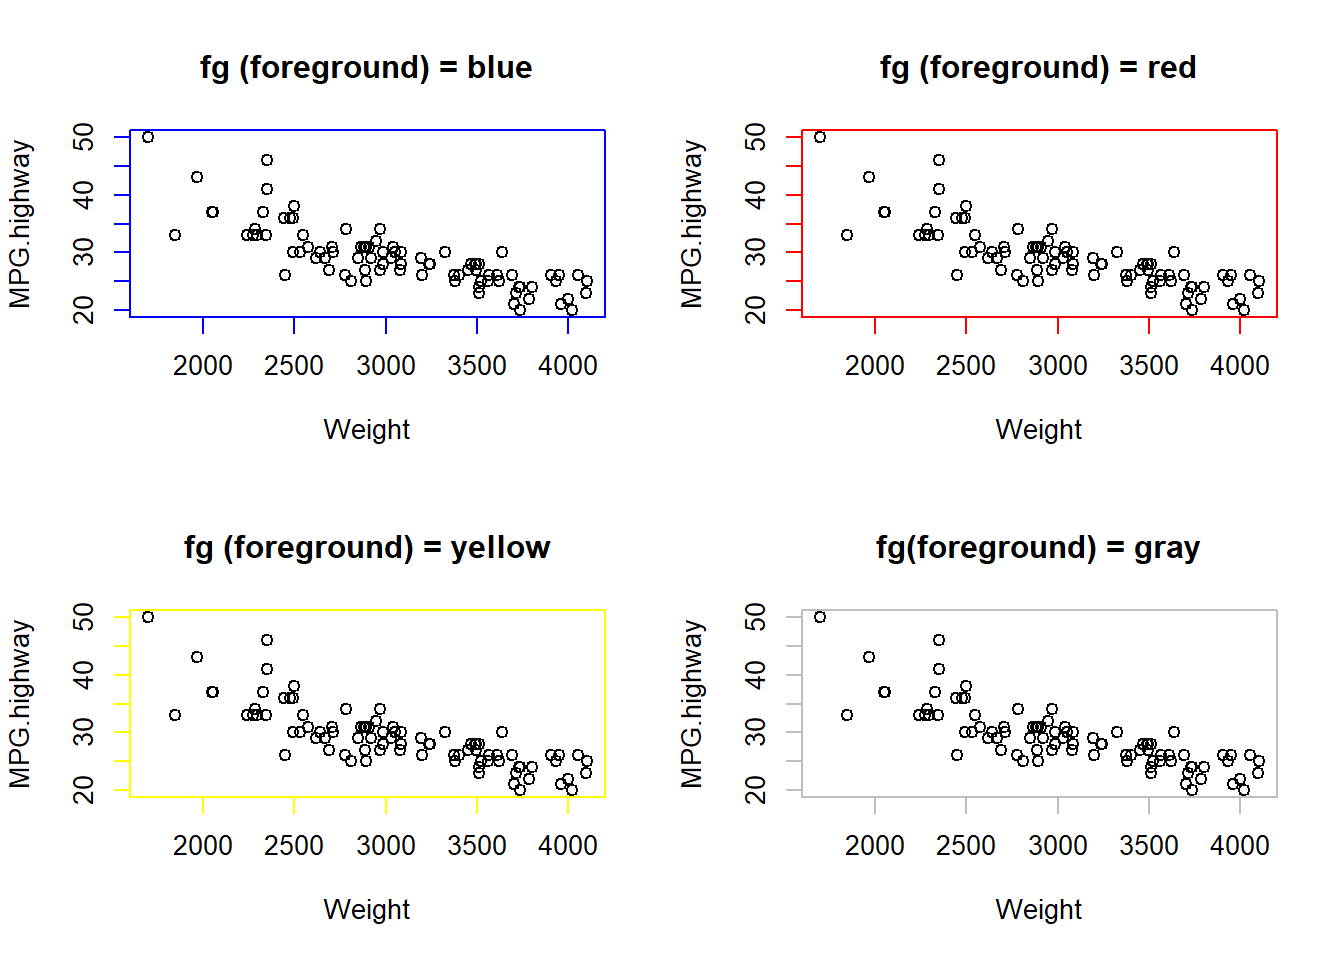
Figure 5.22: 색 지정 : 전경색
5.4.7 그래프 배경 색 지정
bg는 그래프 기호의 배경색을 채울 때 사용합니다. 아래에 기호 모양 21번 (원)에 파랑색, 빨강색, 노랑색, 회색을 채워보았습니다.
## 그래프 배경 색 지정 : bg
par(mfrow = c(2, 2))

plot(MPG.highway ~ Weight, Cars93, cex = 2, pch = 21,
     bg = "blue", main = "bg (background) = blue")

plot(MPG.highway ~ Weight, Cars93, cex = 2, pch = 21,
     bg = "red", main = "bg (background) = red")

plot(MPG.highway ~ Weight, Cars93, cex = 2, pch = 21,
     bg = "yellow", main = "bg (background) = yellow")

plot(MPG.highway ~ Weight, Cars93, cex = 2, pch = 21,
     bg = "gray", main = "bg (background) = gray")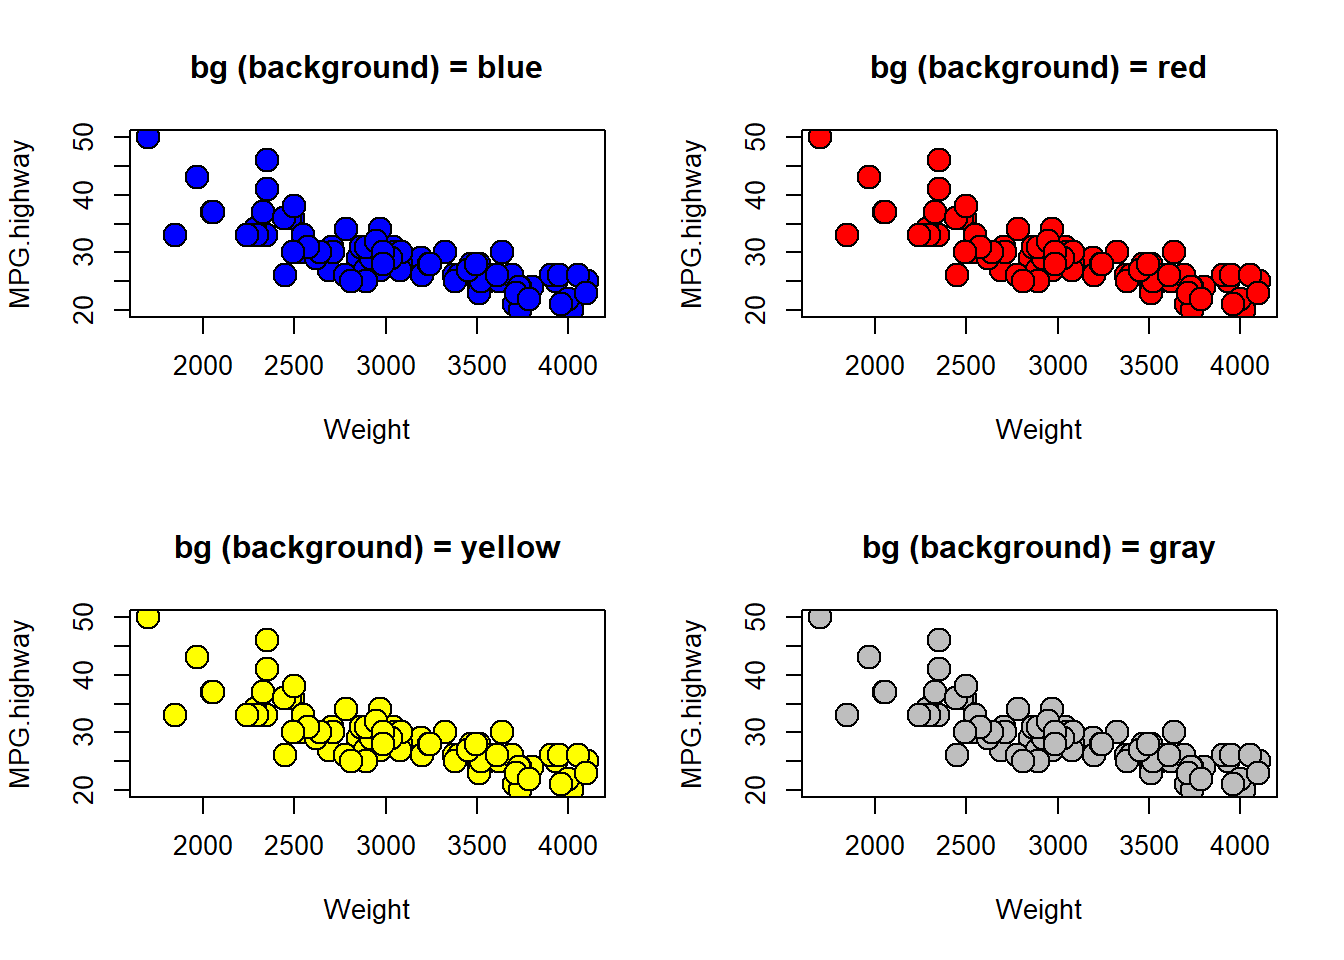
Figure 5.23: 색 지정 : 배경색
bg (background color)는 속이 비어있는 pch 21번부터 25번 까지만 사용가능하며, 그 외에는 적용이 안됩니다. 아래에 pch =1 일 때 bg 옵션이 적용이 안된 것을 확인할 수 있습니다.
## bg (background color) only works with pch from 21 to 25
par(mfrow=c(3,2))

plot(MPG.highway ~ Weight, Cars93, cex = 2, pch = 1,
     bg = "blue", main = "pch = 1, bg is not working")

plot(MPG.highway ~ Weight, Cars93, cex = 2, pch = 21,
     bg = "blue", main = "pch = 21, bg is working")

plot(MPG.highway ~ Weight, Cars93, cex = 2, pch = 22,
     bg = "blue", main = "pch = 22, bg is working")

plot(MPG.highway ~ Weight, Cars93, cex = 2, pch = 23,
     bg = "blue", main = "pch = 23, bg is working")

plot(MPG.highway ~ Weight, Cars93, cex = 2, pch = 24,
     bg = "blue", main = "pch = 24, bg is working")

plot(MPG.highway ~ Weight, Cars93, cex = 2, pch = 25,
     bg = "blue", main = "pch = 25, bg is working")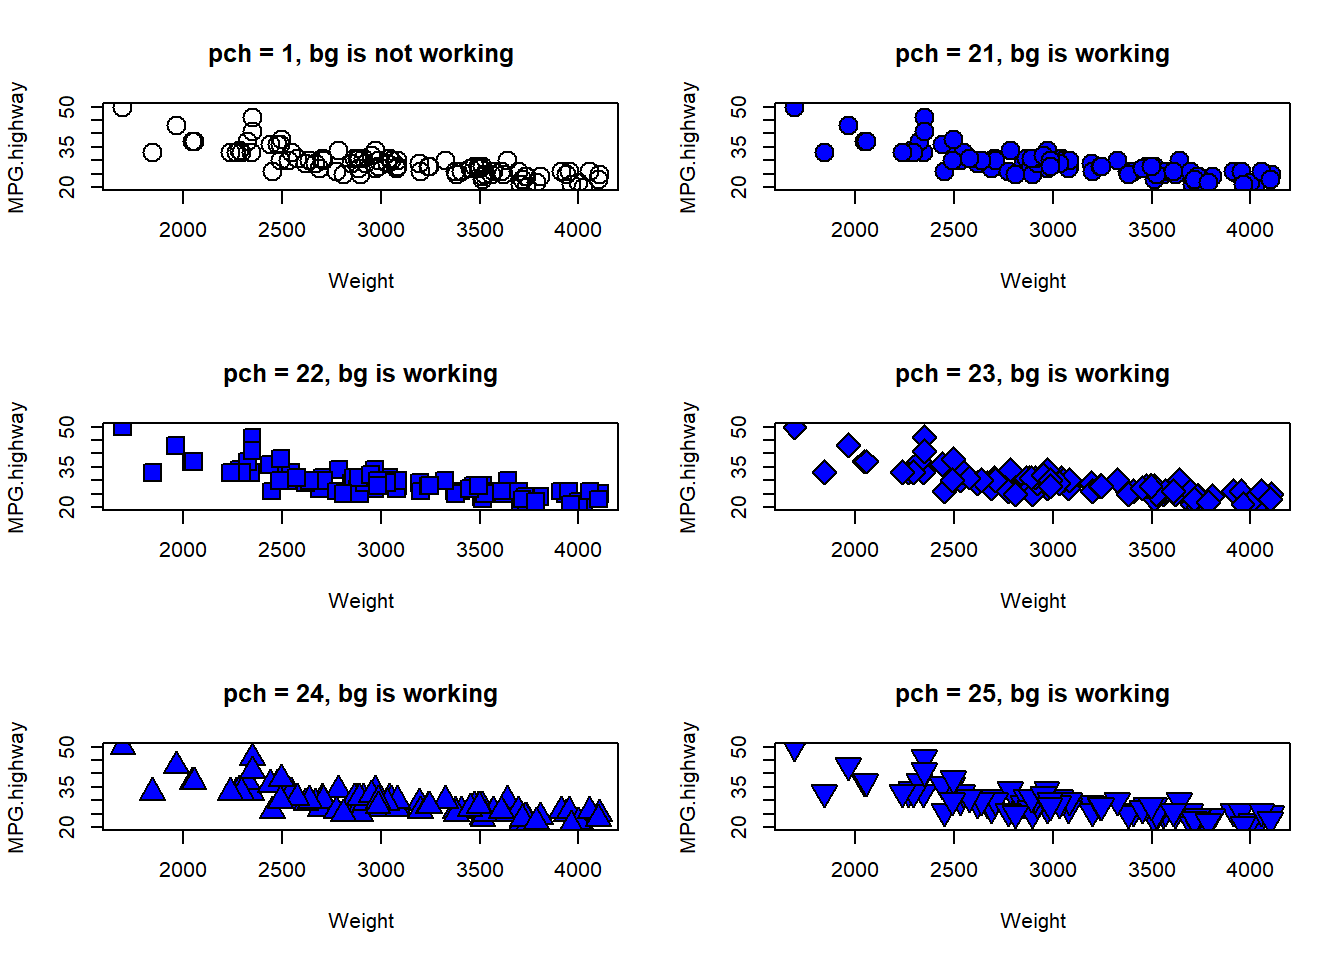
Figure 5.24: 색 지정 : 배경색 미적용
다음 절에서는 그래프 영역과 내/외부 마진 모수 설정하는 방법에 대해서 알아보도록 하겠습니다.